

Some online systems are experiencing problems. NCDC expects the problem to be resolved shortly, please try your request after this message has been removed.
Some online systems are experiencing problems. NCDC expects the problem to be resolved shortly, please try your request after this message has been removed.
|
|
Climate of 2006 - Annual ReportNational Climatic Data Center 11 January 2007 |
 larger image |

|
|
The global annual temperature for combined land and ocean surfaces in 2006 was +0.54°C (+0.97°F) above average, ranking 5th warmest in the period of record. However, uncertainties in the global calculations due largely to gaps in data coverage make 2006 statistically indistinguishable from 2005 and several other recent warm years as shown by the error bars on the global time series. Globally averaged land temperatures were +0.78°C (+1.40°F) and ocean temperatures +0.45°C (+0.81°F) above average, ranking 4th and 5th warmest, respectively. The land and ocean surface temperatures for the Northern and Southern Hemisphere ranked 2nd and 6th warmest, respectively.
The year began with ENSO in a weak cold phase (La Niña) which had developed during late 2005, and the presence of these La Niña conditions in the equatorial Pacific contributed to the lower global average temperature this year. By April and May 2006, the near-equatorial SST anomalies had warmed to near-normal in the central Pacific region as the ENSO transitioned to a neutral phase. El Niño conditions developed in September, and by the end of December, sea surface temperatures in most of the central and eastern equatorial Pacific were more than 1.0°C (1.8°F) above average. This El Niño event is likely to persist through May 2007, according to the latest information from NOAA's Climate Prediction Center. For more information on the state of ENSO during 2006, please see the ENSO monitoring annual summary. |
| January-December | Anomaly | Rank | Warmest Year on Record |
|---|---|---|---|
GlobalLandOcean Land and Ocean |
+0.78°C (+1.40°F) +0.45°C (+0.81°F) +0.54°C (+0.97°F) |
4th warmest 5th warmest 5th warmest |
2005 (+0.97°C/1.75°F) 2003 (+0.48°C/0.86°F) 2005 (+0.61°C/1.10°F) |
Northern HemisphereLandOcean Land and Ocean |
+0.87°C (+1.57°F) +0.49°C (+0.88°F) +0.63°C (+1.13°F) |
3rd warmest 4th warmest 2nd warmest |
2005 (+1.02°C/1.84°F) 2005 (+0.54°C/0.97°F) 2005 (+0.72°C/1.30°F) |
Southern HemisphereLandOcean Land and Ocean |
+0.54°C (+0.97°F) +0.43°C (+0.77°F) +0.44°C (+0.79°F) |
6th warmest 5th warmest 6th warmest |
2005 (+0.83°C/1.49°F) 1998 (+0.50°C/0.90°F) 1998 (+0.54°C/0.97°F) |
| **The 1901-2000 average combined land and ocean annual temperature is 13.9°C (56.9°F), the annually averaged land temperature for the same period is 8.5°C (47.3°F), and the long-term annually averaged sea surface temperature is 16.1°C (60.9°F). |
|
| During the past century, global surface temperatures have increased at a rate near 0.06°C/decade (0.11°F/decade) but this trend has increased to a rate approximately 0.18°C/decade (0.32°F/decade) during the past 25 to 30 years. There have been two sustained periods of warming, one beginning around 1910 and ending around 1945, and the most recent beginning about 1976. Temperatures during the latter period of warming have increased at a rate comparable to the rates of warming projected to occur during the next century with continued increases of anthropogenic greenhouse gases.
Temperature measurements have also been made above the Earth's surface over the past 50 to 60 years using balloon-borne instruments (radiosondes) and for the past 28 years using satellites. These measurements support the analysis of trends and variability in the troposphere (surface to 10-16 km) and stratosphere (10-50 km above the earth's surface). |
 larger image |
The best source of upper air in-situ measurements for studying global temperature trends above the surface is the Radiosonde Atmospheric Temperature Products for Assessing Climate (RATPAC) dataset. |
| Data collected and averaged between the 850-300 mb levels (approximately 5000 to 30,000 feet above the surface) indicate that 1958-2006 global temperature trends in the middle troposphere are similar to trends in surface temperature; 0.12°C/decade for surface and 0.15°C/decade for mid-troposphere. Since 1976, mid-troposphere temperatures have increased at a rate of 0.19°C/decade (0.34°F/decade). For the January-December 2006 period, global mid-troposphere temperatures were 0.56°C (1.01°F) above the 1971-2000 mean, 3rd warmest. |
| Since 1979, NOAA's polar orbiting satellite measurements have also been used to measure temperatures in the troposphere and stratosphere. Microwave Sounding Unit (MSU) data are analyzed for NOAA by the University of Alabama in Huntsville (UAH), Remote Sensing Systems (RSS, Santa Rosa, California) and the University of Washington (UW). These observations show that the global average temperature in the middle troposphere (the layer which is centered at an altitude of 2 to 6 miles, but which includes the lower stratosphere) has increased, but differing analysis techniques have yielded similar but different trends (see below). |
 larger image |
 larger image |
| In all cases these trends are positive. The analysis performed by RSS reveals a trend of 0.13°C/decade (0.23°F/decade) while the UAH analysis reveals a much lower trend of 0.05°C/decade (0.09°F/decade). When adjusted by University of Washington scientists to remove the stratospheric influences from the RSS and UAH mid-troposphere average, the trends increase to 0.19°C/decade (0.34°F/decade) and 0.12°C (0.22°F/decade), respectively. (A journal article is available that describes the University of Washington adjustments to remove the stratospheric influence from mid-troposphere averages.) Trends in these MSU time series are similar to the trend in global surface temperatures, which increased at a rate near 0.17°C/decade (0.31°F/decade) during the same 28-year period. |
| While middle tropospheric temperatures reveal an increasing trend over the last two-and-a-half decades, stratospheric temperatures (14 to 22 km / 9 to 14 miles above the surface) have been below average since the warming effects from the 1991 Mt. Pinatubo eruption dissipated in 1993. The below average stratospheric temperatures are consistent with the depletion of ozone in the lower stratosphere and the effects of increasing greenhouse gas concentrations. The large temperature increase in 1982 was caused by the volcanic eruption of El Chichon, and the increase in 1991 was caused by the eruption of Mt. Pinatubo in the Philippines. |  larger image |
|
| Warmer than average conditions occurred throughout most land areas of the world again in 2006. The largest anomalies were present throughout high latitude regions of the Northern Hemisphere including much of North America, Scandinavia, China and Africa. Temperatures in these regions were 2-4°C (3.6-7.2°F)* above the 1961-1990 average. The only widespread area of negative anomalies occurred in central Russia. |
 larger image |
 larger image |
| The map, above left, is created using data from the Global Historical Climatology Network (GHCN), a network of more than 7,000 land surface observing stations. The map, above right, is a product of a merged land surface and sea surface temperature anomaly analysis developed by Smith and Reynolds (2005). Temperature anomalies with respect to the 1961-1990 mean for land and ocean are analyzed separately and then merged to form the global analysis. Additional information on this product is available. |
| Notable temperature extremes in 2006 included a heat wave that affected a large portion of the United States during July 16-25. California was particularly affected, with 140 deaths attributed to high temperatures soaring past 40°C (104°F). Hot weather also enveloped much of Europe during mid-to-late July, with temperatures surpassing 32°C (90°F). In Britain, on the afternoon of July 19th, temperatures reached 36.5°C (97.7°F) at Wisley, the hottest July temperature ever recorded in Britain. By late July across Europe, at least 50 deaths were blamed on the heat in Spain, France, Italy and the Netherlands.
In India, frost was observed in New Delhi for the first time in 70 years as cold air flowing from the Himalayas produced a low temperature of 0.2°C (32.3°F) on January 9th. The record low occurred on January 16, 1935, when -0.6°C (31°F) was reported. In Russia, a severe cold wave, which arrived during January 17-18, brought some of the coldest temperatures to the region in decades. Moscow temperatures plummeted to -30°C (-22°F), the coldest readings since the winter of 1978-1979, when temperatures dropped to -38°C (-36°F). In June, unseasonably cold temperatures affected areas of Australia, with many locations breaking their all-time record minimum temperatures for the month. Averaged across Australia as a whole, it was the fourth coldest June in the post-1950 record. Additional information on other notable weather events can be found in the Significant Events section of this report, or through the monthly Climate Perspectives reports. |
|
 larger image |
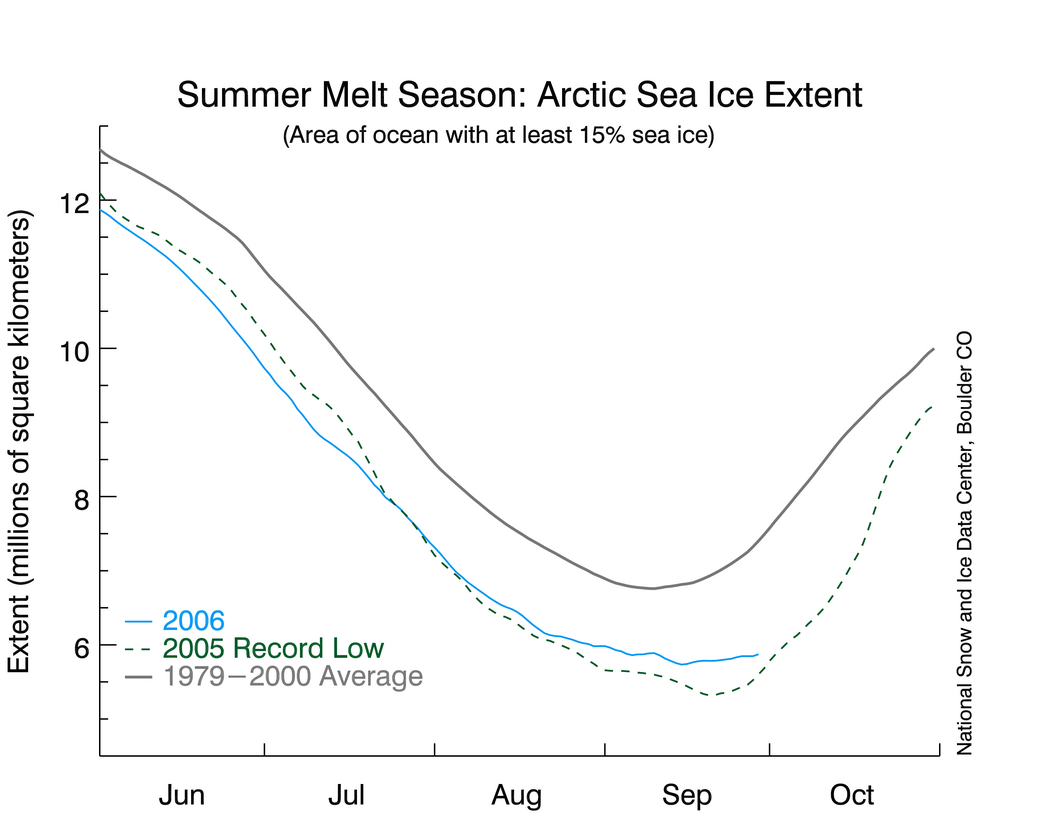
According to the National Snow and Ice Data Center, the Northern Hemisphere sea ice extent, which is measured from passive microwave instruments onboard NOAA satellites, was 5.9 million square kilometers as of September 14, 2006, the second lowest on record (image to the left). This is the fifth consecutive year September sea ice extent has been below the long-term (1978-2000) mean. The September rate of sea ice decline is now almost 9 percent per decade (60,421 square kilometers per year). |
|
From January to mid-July 2006, the sea ice extent was well below the record set just last year. However, in August, temperatures near the pole were 1°C to 2°C cooler than average, inhibiting further melting. For further information on Northern Hemisphere snow and ice conditions, please see the NSIDC News page, provided by the NOAA's National Snow and Ice Data Center (NSIDC).
Arctic sea ice conditions are inherently variable from year to year in response to wind, temperature and oceanic forcings. Quite often, a "low" ice year is followed by recovery the next year. But increasing surface temperatures in high latitudes have contributed to progressively more summer melt and less ice growth in the fall and winter. While natural variability is responsible for year-to-year variations in sea ice extent, three extreme minimum extent years along with evidence of thinning of the ice pack suggest that the sea ice system is experiencing changes which may not be solely related to natural variability. |
|
| As shown in the time series to the right, mean Northern Hemisphere snow cover extent during winter (December 2005 - February 2006) was slightly above average. Much of this was due to anomalously cold and snowy conditions across Asia and Europe. Mean Northern Hemisphere winter snow cover extent for the 1967-2006 period of record is 45.4 million square kilometers. |  larger image |
 larger image |
Snow cover for the 2005-2006 winter season across North America was below average. Mean North American winter snow cover extent is 17 million square kilometers for the 1967-2006 period of record. 15 of the past 20 years have been below average. |
| Northern Hemisphere snow cover extent was slightly below average during the March-May spring season. As shown in the time series graph to the right, spring snow cover extent in the Northern Hemisphere has been below average in 16 of the past 19 years. This is in part due to a trend to warmer spring temperatures that has led to more rapid loss of snow cover during the transition season between winter and summer. Mean Northern Hemisphere spring snow cover extent is 30.9 million square kilometers for the 1967-2006 period of record. |  larger image |
 larger image |
Spring snow cover extent has also been below average across North America in much of the past two decades. Snow cover extent was significantly below average for the spring 2006 season, the 17th below average year since 1985 Mean North America spring snow cover extent is 13 million square kilometers for the 1967-2006 period of record.
(Data were provided by Global Snow Laboratory, Rutgers University). |
|
 larger image  larger image |
Global precipitation in 2006 was much above the 1961-1990 average, the largest value in five years. Regionally drier than average conditions were widespread across the U.S. Great Plains and Gulf Coast regions, the western coast of Canada and most of Australia. While the northeast U.S., Amazon Basin, India and Alaska all experienced wetter than average conditions. A severe long-term drought continued throughout southern Ethiopia, southern Somalia, northeastern Kenya, as well as adjacent areas of eastern Uganda and Tanzania for most of the year. In February, drought in Somalia was characterized as the worst in a decade. In all, an estimated 11 million people in East Africa and the Horn of Africa continued to face critical food shortages brought about in part by the continuing drought despite the welcome rainfall that began in June. |
|
In May, drought in China threatened the drinking water supply for nearly 14 million people in the northern part of the country. About 16.3 million hectares (40 million acres) of agriculture land, more than 12 percent of the nation's total, was affected by drought.
On Leyte Island, in the Philippines, approximately 20 inches (500 mm) of rain fell during the first half of February, leading to more than 1000 lives lost when the village of Guinsaugon was buried by a landslide. The Philippines was also affected by five landfalling typhoons in 2006, including Super Typhoon Durian which hit the southeastern part of the island on November 30. During June, southern China received rainfall rates on the order of 99 mm (3.5 inches) in two hours forcing the Bashili River out of its banks and flooding 11 villages in the Fujian province. The Chinese government characterized the summer flooding as the worst in 30 years in parts of the country, with 349 weather-related deaths in June. For more information about precipitation extremes during 2006, see the annual report of Significant Events. Additional information on other notable weather events can be found in the Significant Events section of this report, or through the monthly Climate Perspectives reports.
|
| NOAA's National Climatic Data Center is the world's largest active archive of weather data. The temperature and precipitation rankings are available from the center by calling: 828-271-4800.
NOAA works closely with the academic and science communities on climate-related research projects to increase the understanding of El Niño and improve forecasting techniques. NOAA's Climate Prediction Center monitors, analyzes and predicts climate events ranging from weeks to seasons for the nation. NOAA also operates the network of data buoys and satellites that provide vital information about the ocean waters, and initiates research projects to improve future climate forecasts.
|
|
|
For all climate questions other than questions concerning this report, please contact the National Climatic Data Center's Climate Services Division:
|
 Top of Page |
|
|
   Downloaded Saturday, 09-May-2009 19:42:55 EDT Last Updated Wednesday, 20-Aug-2008 12:30:49 EDT by Ahira.Sanchez-Lugo@noaa.gov Please see the NCDC Contact Page if you have questions or comments. |