

|
|
Observed Trends and Variability in Land and Ocean Surface Temperatures National Climatic Data Center
|

IntroductionSurface temperatures in most parts of the world have risen since the beginning of the 20th century. The increases have been observed through measurements taken at thousands of land surface stations and on ocean surfaces by ships, buoys, floats, and in the past 25 to 30 years by satellites. Although surface temperature measurements are not the only indicators that the Earth has warmed*, this record provides important information on the rate of change and the variability that has occurred during the past century. Included on this page are time series of global and hemispheric mean temperature time series and maps of the spatial distribution and magnitude of temperature trends during two periods, 1901-2003 and 1979-2003. The trend maps are provided on annual and seasonal time scales.The time series were produced using the method described in Quayle et al. (1999), while the spatial trend maps were produced using the GHCN-ERSST blended dataset of land and ocean temperatures (Smith and Reynolds, 2005). *The observed temperature increases have been accompanied by other phenomena such as decreases in mountain glacier extent and snow cover, shortening seasons of lake and river ice, decreases in Arctic sea-ice extent, and a rise in global average sea level (IPCC, 2001).
| ||||||||||||

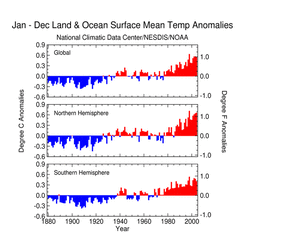
pdf version / gif version pdf version / gif version Although yearly and decadal variations are evident in these time series of annual global surface mean temperatures, the 1901-2004 long-term trend in combined land and ocean temperatures is positive (+0.6°C/century). Land surface temperatures have increased at a rate of +0.8°C/century while ocean surface temperatures have risen +0.6°C/century during the same time period. The trend has increased to +0.17°C/decade during the past 25-year period (1979-2004) for combined land and ocean temperatures. |
|---|
 Annual 1901-2003
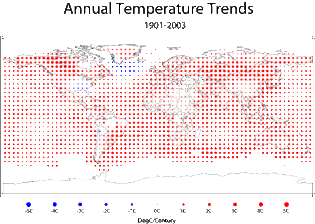
pdf version / gif version pdf version / gif version Temperatures have increased in most parts of the world, with many of the largest increases occurring in the high latitude land areas of the Northern Hemisphere. |
|---|
Seasonal 1901-2003


pdf version / gif version pdf version / gif version 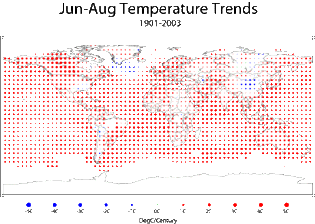
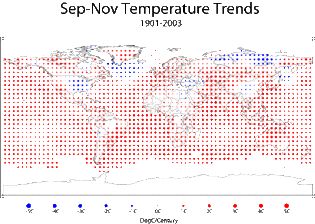
pdf version / gif version pdf version / gif version Seasonal trends indicate the largest increases have generally occurred in the boreal winter and spring seasons. |
|---|
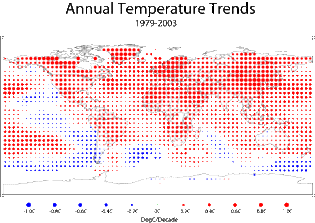
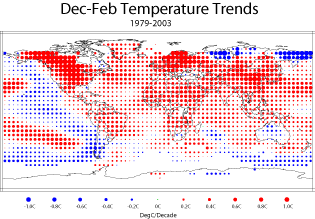
Seasonal 1979-2003

pdf version / gif version pdf version / gif version 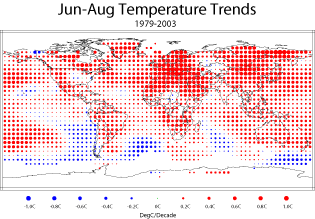
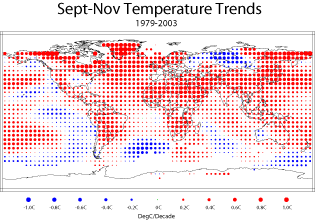
pdf version / gif version pdf version / gif version The more rapid rate of global surface temperature increases during the past 25 years (see time series above) are also evident in these trend maps for the period 1979-2003. |
|---|
|
|
For all climate questions other than questions concerning this report, please contact the National Climatic Data Center's Climate Services Division:
|
|
   Downloaded Tuesday, 16-Sep-2008 07:19:38 EDT Last Updated Thursday, 28-Aug-2008 07:00:11 EDT by Alvin.L.McGahee@noaa.gov Please see the NCDC Contact Page if you have questions or comments. |