
National
Institute for Occupational Safety and
Health
Worker Health Chartbook, 2000
September, 2000
DHHS (NIOSH) Publication No.
2000-127
|
National
Institute for Occupational Safety and
Health |

This section presents a detailed overview of mining and injuries. Historically, mining has been the industry sector with the highest fatal and nonfatal injury rates. Mining still has the highest fatal injury rate梞ore than five times the national average. Because of the accompanying social toll and public pressures for action, data on fatalities and injuries became available far earlier in the mining industry than in many others. State and Federal agencies began collecting data in the 1870s, and reliable information has been available for an entire century. Examination of the history of coal mining in this century shows important relationships between adverse outcomes (such as fatality rates) and regulatory actions such as enactment of Federal legislation and establishment of enforcement and consultation agencies.
Historical Perspective
More than 103,000 workers died in the mining industry (including all commodities and work locations) during the 85-year period from 1911 to 1995 (
Figure 6�/A>). From 1911 through 1915 alone, 16,646 fatalities occurred, with an annual average of 2,517 deaths in coal mining and 813 in metal and nonmetal mining. The corresponding annual average fatality rates during this 5-year period were 340 and 300 per 100,000 workers in coal mining and metal and nonmetal mining, respectively. The U.S. Bureau of Mines, established in 1910, focused on coal mine fires and explosions. In the first decade after its creation, disaster-related fatalities* in coal mines decreased substantially, with a 62% reduction in deaths from mine fires and a 45% reduction from explosions. Disaster-related fatalities in metal and nonmetal mining increased during the same period. The number and rate of fatalities decreased again during the Great Depression, a period accompanied by reductions in both the labor force and production, as measured by tonnage mined. Rates increased during the economic mobilization required during World War II. For the years 1941�45, 694 million tons of coal were mined annually, compared with 520 million tons for the 5 preceding years梐 33% increase. Coal mining fatality rates increased during the decade preceding the Coal Mine Health and Safety Act of 1969 [Public Law 91�3]. Rates rose similarly for metal and nonmetal mining in the decade before the Federal Mine Safety and Health Act of 1977 [Public Law 95�4]. Fatality rates decreased following the passage of these two Federal mine acts.
 To view, click on image
Figure 6�/b>. Number of fatalities (5-year aggregates) and annual average fatality rates in the mining industry by commodity, 1911�95. Annual average fatality rates are calculated per 100,000 workers aggregated over 5-year periods. Metal and nonmetal includes metal, nonmetal, stone, and sand and gravel. (Source: MSHA [1999]; Adams and Wrenn [1941]; Adams and Kolhos [1941]; Reese et al. [1955]; MSHA [1984].)
Back to Top
Fatal Injuries during
1988�97
Mining operations are located in every State as well as in Puerto Rico and the Virgin Islands. In 1997, 13,682 mining operations reported employment to the Mine Safety and Health Administration (MSHA)�609 were coal mining operations (average employment size of 35 full-time workers); 374 were metal mining operations (average employment size of 122 full-time workers); 786 were nonmetal mining operations (average employment size of 32 full-time workers); 3,712 were stone mining operations (average employment size of 19 full-time workers); and 6,201 were sand and gravel mines (average employment size of 5 full-time workers).
At least one mine operator fatality occurred in each State but Delaware, Maine, and Rhode Island during the period 1988�97 (Figure 6�/A>). The national annual average mine operator fatality rate during this period was 28.5 per 100,000 miners, which is more than five times the national annual average occupational fatality rate of 5.3 per 100,000 workers from 1980 through 1995 [NTOF 1999] (see Figure 2�/A> and preceding text). Nine states had very high mine operator fatality rates that exceeded the national mining fatality rate by 50% or more. Nine other States and Puerto Rico had rates greater than the national rate.
Back to
Top
Figure 6�/b>. Number of mine
operator fatalities (as numbers within State boundaries) and corresponding
annual average fatality rates (shading within States) for each State and Puerto
Rico, 1988�97. (Source: MSHA [1999].)
During the 10-year period 1988�97, the number of fatalities was highest
in 1990 (n=122) and lowest in 1994 (n=82)
(
 To view, click on image
Despite annual fluctuations, overall fatality rates have decreased for mine operator workers in the coal and metal commodities (Figure 6�/A>). Although fatality rates for independent contractor workers are the highest overall, reduced employment reporting requirements for this sector of workers compromise any direct comparison with rates for mine operator workers.
 To view, click on image
Figure 6�/b>. Number of fatalities, by type of employer (mine operator versus independent contractor) and commodity, 1988�97. Metal and nonmetal includes metal, nonmetal, stone, and sand and gravel. (Source: MSHA [1999].)
 To view, click on image
Figure 6�/b>. Fatality
rates by type of employer (mine operator versus independent contractor) and
commodity, 1988�97. Fatality rates are calculated per 100,000 full-time
workers or 200 million employee hours. Metal and nonmetal includes metal,
nonmetal, stone, and sand and gravel. (Source: MSHA [1999].)
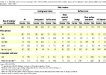
Both the number and annual average rate of fatalities from 1988 through 1997 varied by work location and by type of employer and commodity (Table 6�/A>). Overall, underground work locations exhibited both the highest numbers and rates of fatalities, and preparation plants and mills exhibited the lowest fatality rates. Among mine operator workers, the combination of high numbers and rates of fatalities is most conspicuous for those working in underground coal mines, underground metal mines, stone surface mines (or quarries), and sand and gravel operations. Although independent contractor workers accounted for about one-fifth (19%) of all fatalities during this 10-year period, they accounted for almost one-third (30%) of the fatalities at the surface areas of underground mines, at surface mines, and at mills or preparation plants.
A trend toward decreasing fatality rates with increasing mine size is apparent in underground coal and metal mining operations (Figure 6�/A>). This trend is particularly significant for underground coal mining operations, which also accounted for 83% of all underground employee hours and 77% of all underground fatalities reported during the 10-year period 1988�97. In addition, coal accounted for 90% of the employee hours worked underground in small mines (fewer than 50 workers), followed by stone mines (5.5%), metal mines (3%), and nonmetal mines (less than 1%).
 To view, click on image
Table 6�/b>.
Number and annual average rate of fatalities associated
with various types of employers and commodities by work location,
1988�97
 To view, click on image
Figure 6�/b>. Fatality
rates at underground mining operations, by commodity and employment size of
operation, 1988�97. Fatality rates are computed per 100,000 full-time workers
or 200 million employee hours. (Note: There are no sand and gravel underground
operations.) (Source: MSHA [1999].)
Fatality rates from 1988 through 1997 at surface work locations were
highest at the smallest mining operations (fewer than 10 workers) in every commodity
(
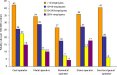
The major types of incidents associated with fatal injuries are shown in
Table 6�/A> by
commodity and type of employer. Overall, powered haulage incidents accounted for
the largest percentage of fatalities (30.8%), followed by fall of ground (18.9%)
and machinery (16.3%). Some types of incidents, such as falls of ground, are
substantially more frequent among mine operators than among independent
contractors. The rate differences between type of employer and among commodities
suggest that different strategies are needed to reduce fatality rates in various
sectors of the mining industry.
Figure 6�/b>. Fatality rates at
surface mining operations, by commodity and employment size of operation,
1988�97. Fatality rates are computed per 100,000 full-time workers or 200
million employee hours. (Source: MSHA [1999].)
 To view, click on image
 To view, click on image
Table 6�/b>. Number and annual average rate of fatalities associated with various types of employers and commodities by type of incident, 1988�97
Back to TopLost-workday injury rates decreased between 1988 and 1997 in all five commodities for mine operator workers and independent contractor workers in metal and nonmetal mining (
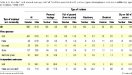
Figure 6�/A>). The lost-workday injury rates for independent contractor workers in coal follow a somewhat different trend, with a gradual increase from 1988 through 1992, then a slow decrease for the remainder of the period. Over the 10-year period, the highest lost-workday injury rate was observed in mine operator workers in coal (7.9 cases per 100 full-time workers), followed by mine operator workers in stone (4.7 cases per 100 full-time workers), sand and gravel (4.1 cases per 100 full-time workers), metal (3.9 cases per 100 full-time workers), and nonmetal mining (3.7 cases per 100 full-time workers). Among mine operator workers, the largest percentage of decrease in the lost-workday injury rate occurred in metal mining, dropping from a rate of 5.4 cases per 100 full-time workers in 1988 to 3.1 cases per 100 full-time workers in 1997 (a 43% decrease). Following metal mining, the decreases in lost-workday injury rates were as follows: coal (35%), nonmetal (31%), stone (30%), and sand and gravel mining (24%). A 46% decrease was observed for independent contractor workers in metal and nonmetal mining, and a 6% decrease was observed for independent contractor workers in coal mining.The number and rate of lost-workday cases from 1988 to 1997 for various work locations are shown by type of employer and commodity in Table 6�/A>. Overall, underground work locations exhibited both the highest numbers and rates of lost-workday cases, whereas surface strip/open pit/quarry operations exhibited the lowest rates. Among mine operator workers, a combination of high numbers and rates of lost-workday cases are most conspicuous for workers in underground coal mines, stone surface mines (or quarries) and mills, and sand and gravel operations. Independent contractor workers accounted for less than 6% of all lost-workday cases but 19% of all fatalities (see Table 6�/A>).
The leading types of incidents associated with lost-workday cases (Table 6�/A>) are handling materials (34.4%), slip or fall of person (20.9%), powered haulage (10.9%), machinery (10.9%), and hand tools (9.5%). These incidents accounted for 86.6% of all cases between 1988 and 1997. Incidents involving handling materials accounted for more than one-third of all lost-workday cases, compared with fewer than 1% of the fatalities. Furthermore, these incidents account for 29.2% of the 6,840,987 lost workdays, followed by slip or fall of person (20.8%) and powered haulage (17.3%).
Sprains to the back region accounted for the largest proportion of lost workdays during the 10-year period (
Figure 6�/A>). Sprains to the lower extremities (primarily the knee), amputations of the arms or hands (primarily the fingers), and fractures to the lower extremities also accounted for a substantial proportion of lost workdays. Back to Top
 To view, click on image
Figure 6�/b>. Incidence rates for
lost-workday cases, by type of employer and commodity, 1988�97. Incident rates
are calculated per 100 full-time workers or 200,000 employee hours. Metal and
nonmetal includes metal, nonmetal, stone, and sand and gravel. (Source: MSHA
[1999].)
 To view, click on image
Table 6�/b>. Number and annual average rate of lost-workday cases associated with various types of employers and commodities by work location, 1988�97
Back to Top To view, click on image.
Table 6�/b>. Number and annual average
rate of lost-workday cases and mean days lost associated with various types
of employers and commodities by type of incident,
1988�97
Figure 6�/font>. Lost workdays
in mining, by part of body affected and nature of injury, 1988�97. (Source:
MSHA [1999].)
Updated on 06/25/02
 To view, click on image
![Figure 6�/A>). The national annual average mine operator fatality rate during this period was 28.5 per 100,000 miners, which is more than five times the national annual average occupational fatality rate of 5.3 per 100,000 workers from 1980 through 1995 [NTOF 1999] (see](Imgload.asp?Picname=Fig6-2.gif&Picref=2a&Picnum=1&PicW=1261&PicH=737)