NCDC | Climate | Products | Events | Search | Help
During the week of January 5-9, 1998, the eastern U.S. and eastern Canada were severely effected by a storm system with a very deep southerly flow and abundant moisture. This resulted in flooding rains from the lower Mississippi valley through the southeast and into the northeast, several tornadoes, and a severe ice storm in parts of the northeast/New England and into Canada. The death toll for the event:
Flood-related:
Tennessee--7
North Carolina--2
South Carolina--1
Kentucky--1
Alabama--1
Ice storm-related:
Canada--28
New York--9
Maine--5
New Hampshire--2
U.S/Canada total: 56
The heaviest rains and most severe flooding occurred in the mountains of North Carolina and northeast Tennessee, where up to 16 inches fell in a 2-day period. See below for some of the rainfall totals. Surveys indicate over 500 homes destroyed or with severe damage in North Carolina, and over 200 homes severely damaged or destroyed in Tennessee. Damages exceeded $15 million for western North Carolina and $20 million for eastern Tennessee. Tornado touchdowns produced some damage in Dublin, Georgia and Easley, South Carolina. Flooding also was a problem in parts of the lower Mississippi valley and upstate New York.
The severe ice storm mainly affected upstate New York, northern New Hampshire and Vermont, much of Maine, and southeast Canada. Some locations received over 3 inches of rain (as freezing rain), with radial ice thickness of one inch or more. Canada reported over 3 million utility customers without power immediately after the storm, while the northeast through New England reported over 500,000 customers without power. 80% of Maine's population lost electrical service. Overall damages approached $3 billion for Canada and were at least $1.4 billion for the U.S.
For further information, see:
NCDC Storm Data publication for Jan 98,
US Army CRREL special report (1.9 mb pdf file)
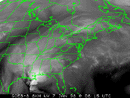
Warning to modem users: Image files larger than 50KB are indicated showing approximate size of the file. Click on each of the following to view full size images. Additional images will be added later as available. Note that the 'time stamp' within each image is Greenwich time (Z-time).
The following are rainfall totals, in inches, for January 7-8, 1998 in northeast Georgia, northwest South Carolina, and western North Carolina. Amounts provided by National Weather Service's Greenville-Spartanburg office:
NORTHEAST GEORGIA COUNTIES:

COUNTY        LOCATION                  RAINFALL (INCHES)

RABUN         MOUNTAIN CITY             5.90
HABERSHAM     CLARKESVILLE              5.06
              CORNELIA                  4.68
STEPHENS      TOCCOA                    4.71
FRANKLIN      CARNESVILLE               2.88
HART          HARTWELL                  2.70
ELBERT        ELBERTON                  2.17

UPSTATE SOUTH CAROLINA COUNTIES:

OCONEE        SALEM                     6.10
              KEOWEE                    5.37
              JOCASSEE                  5.25
              CLEMSON                   3.67
              WALHALLA                  2.68
PICKENS       TABLE ROCK                6.50-7.00
              PICKENS/EASLEY            5.00-6.00
              CEDAR ROCK                4.00
              3 MI SE EASLEY            3.03
ANDERSON      ANDERSON AIRPORT          2.95
              WEST PELZER               2.75
              WILLIAMSTON               2.30
GREENVILLE    US 25 NEAR NC BORDER      5.25
              HUNTS BRIDGE              3.79
              GOWENSVILLE               3.65
              TRAVELERS REST            3.40
              CAESARS HEAD              3.16
              GREENVILLE                2.82
SPARTANBURG   CAMPOBELLO                3.90
              20 MI N GREER             3.60
              GSP AIRPORT               2.22
              LAKE BOWEN                1.12
              WOODRUFF                  1.00
LAURENS       CLINTON                   1.22
ABBEVILLE     ANTREVILLE                1.51
              CALHOUN FALLS             1.25
              LAKE RUSSELL              0.88
GREENWOOD     WARE SHOALS               1.00
              GREENWOOD                 0.49
CHEROKEE      GAFFNEY                   1.67
YORK          YORK                      1.42
              LAKE WYLIE                0.90
CHESTER       CHESTER                   1.04

WESTERN NORTH CAROLINA COUNTIES:

GRAHAM        ROBBINSVILLE              2.58
              WAUCHECHA                 2.40
CLAY          MURPHY                    2.06
SWAIN         TROUT FARM                4.84
              BRYSON CITY               3.45
              PIN OAK GAP               3.32
MACON         HIGHLANDS                 9.63
              OTTO                      5.47
              FRANKLIN                  4.67
              HARRISON GAP              2.72
JACKSON       HOGBACK MTN              16.12
              ROBINSON CREEK           15.33
              COLD CREEK               13.36
              TANASEE CREEK            12.96
              WOLF CREEK               11.64
              CHARLEY RIDGE            10.91
              CEDAR CLIFF               9.00
              TUCKASEGEE                7.40
              PUMPKINTOWN               6.72
              SYLVA KINGS MTN           5.20
              CULLOWHEE                 2.96
HAYWOOD       MT HARDY                 12.20
              DANIEL RIDGE              8.16
              WAYNESVILLE               3.47
TRANSYLVANIA  5 MI NW CEDAR MTN        14.50
              CONNESTEE FALLS          12.38
              LAKE TOXAWAY             10.63
              ROSMAN                    9.02
              BREVARD                   8.92
              PISGAH FOREST             7.92
              BALSAM GROVE              7.80
              RICH MTN                  7.24
HENDERSON     SUGARLOAF MTN             9.17
              BEARWALLOW CREEK          7.81
              HORSEPEN MTN              6.84
              ETOWAH                    7.67
              HENDERSONVILLE            6.09
              MILLS RIVER               5.54
              DANA                      5.08
BUNCOMBE      BEAVERDAM CREEK           7.96
              MT PISGAH                 5.92
              FLAT TOP MTN              5.07
              ASHEVILLE AIRPORT         4.70
              BARNARDSVILLE             4.36
              CANDLER                   3.82
              ASHEVILLE DOWNTOWN        3.35
              NEWFOUND CREEK            3.08
MADISON       DUCKETT TOP & IVY GAP     3.36
              LITTLE PINE CREEK         3.16
              MARSHALL                  2.49
              HOT SPRINGS               1.64
              ROLLINS                   1.36
YANCEY        BLUE ROCK                 7.64
              MT MITCHELL               7.50
              BLACK MTN                 4.86
MITCHELL      SPRUCE PINE               9.64
              HAWK                      4.85
AVERY         GRANDFATHER MTN           5.15
              BEECH MTN                 3.56
              NEWLAND                   1.84
ASHE          JEFFERSON                 4.32
CALDWELL      LENOIR                    2.31
              EDGEMONT                  1.52
              RHODHISS                  0.92
              BAILEY CAMP               0.88
BURKE         JONAS RIDGE               7.71
              MORGANTON                 2.22
              BRIDGEWATER               2.02
              HICKORY AIRPORT           1.47
MCDOWELL      OLD FORT                  6.29
RUTHERFORD    FOREST CITY               1.52
POLK          TRYON                     4.38
CATAWBA       LOOKOUT SHOALS            0.60
              OXFORD SHOALS             0.58
              COWAN FALLS               0.42
CLEVELAND     CASAR                     1.63
LINCOLN       LINCOLNTON                1.86
              VALE                      1.18
GASTON        MTN ISLAND                0.50
IREDELL       TURNERSBURG               1.27
ROWAN         SALISBURY                 1.05
MECKLENBURG   CHARLOTTE AIRPORT         1.26
CABARRUS      CONCORD                   1.34
              MT PLEASANT               0.99
The last ice storm to strike with this (or greater) intensity was during February 1994 in the southeast. In 1994, NCDC prepared the report 1994 Weather in the Southeast: February Ice Storm and July Flooding about that storm.
NWS Office of Hydrology
Federal Emergency Management Agency
El Nino Information
Climate Change and Weather Extremes
 Top of Page Top of Page
http://www.ncdc.noaa.gov/oa/reports/janstorm/janstorm.html
Downloaded Thursday, 15-Jan-2009 18:48:31 EST
Last Updated Thursday, 02-Nov-2006 17:51:42 EST by Neal.Lott@noaa.gov, Doug.Ross@noaa.gov, Axel.Graumann@noaa.gov
Please see the NCDC Contact Page if you have questions or comments.
|