|
The third step in the process involved
analyses of the data compiled previously
to test different methods for which pertinent
data currently exist. Part of this process
involved experimentation with different
equations and computational methods to
determine which specific formulas are
most appropriate for each of the four
types of facilities. These activities
revealed a number of interesting and important
insights about nursing shortages, which
are summarized below.
A. Preliminary
Analyses
Figure 8 presents the distribution of
the indicator of difficulty recruiting
RNs based on all facilities in North Carolina.
The figure shows the number of facilities
that experienced difficulty recruiting
RNs (indicator >3) was more than double
the number of the facilities with no difficulty
recruiting RNs (indicator <3). In this
case, 68 facilities (20.9%) reported not
having difficulty recruiting RNs compared
to 155 facilities (47.7%) that reported
having difficulty recruiting RNs. The
figure also shows that only 17 facilities
(5.2%) reported that it was very easy
to recruit RNs, in contrast to 56 facilities
(17.2%) that reported it was very difficult
to recruit RNs.
Figure
8. Distribution of RN Recruitment Difficulty
Indicator, Based on Four Types of Health
Facilities in North Carolina in 2004
 [D] [D]
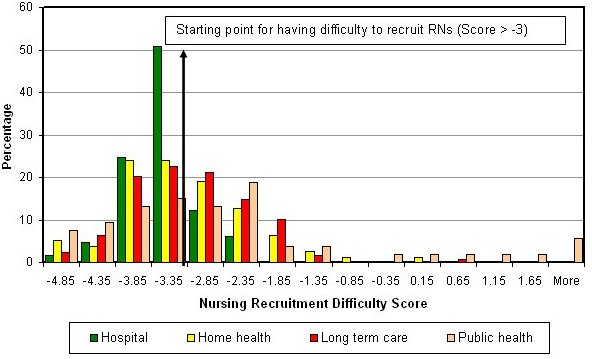
Figure 9 presents the distribution of
difficulty indicator by facility type.
From this figure we can see that the distributions
of difficulty to recruit RNs were different
among all four types of facilities. For
example, 4.6% of hospitals reported it
was very difficult to recruit RNs, in
contrast to 26.4% of public health facilities
reported very difficult to recruit RNs.
Figure
9. Nursing Recruitment Difficulty Indicators
in North Carolina, by Facility Type, 2004
 [D] [D]
Figure 10 compares the distributions
of the predicted recruiting difficulty
scores for the four types of facilities
in North Carolina, based on the Ordered
Probit model estimated using data for
2004. The figure shows clearly that the
variation in recruiting difficulty is
greatest for public health agencies and
least for hospitals. It also shows that
on average both public health agencies
and long-term care facilities have statistically
significantly greater difficulty recruiting
RNs than hospitals (p≤0.05, since
the 95% confidence intervals do not overlap).
Figure
10. Distribution of Predicted Difficulty
Recruiting RNs in North Carolina by Type
of Facility, 2004
 [D]
[D]
Table 2 presents the distribution of
facility type by difficulty indicator
and Chi-Square statistic to test the null
hypothesis that there is no association
between type of facility and the difficulty
recruiting RNs. Based on the Chi-square
statistic, the null hypothesis was rejected
(p = 0.011) because different types of
facilities had different levels of difficulty
recruiting RNs. The implication was that
different types of facilities have different
behaviors in term of modeling nursing
shortages.
Table
2. Distribution of Type of Facility by
Nursing Recruitment Difficulty Indicator
Chi-Square = 25.9 (df = 12)
Test of H0: No association
between type of facility and difficulty
to recruit
H0 is rejected with p-value
= 0.011
Table 3 presents the distribution of
difficulty indicator by number of adverse
consequences of shortages and the Spearman
correlation coefficient to test the null
hypothesis that there is no relationship
between difficulty indicator and number
of consequences. From the Spearman correlation
statistic, the null hypothesis was rejected
(p<0.0005), meaning that on average
facilities that experienced greater difficulty
recruiting RNs had more bad consequences.
Table
3. Distribution of Nursing Recruitment
Difficulty Indicator by Number of Bad
Consequences
Spearman correlation coefficient = 0.343
Test of H0: Correlation =
0
H0 is rejected with p-value
< 0.0005
B. Empirical
Models for North Carolina Hospitals
A number of models were estimated for
hospitals in North Carolina. The steps
followed are summarized below.
The indicator of nursing shortage used
as a dependent variable was the number
of reported negative effects on operations
revealed by a facility. Most facilities
indicated no effects or only one effect.
The mean value for all facilities was
0.89, with a standard deviation of 1.07.
Based on this, we defined facilities as
being needy (for test purposes only),
if they presented two or more effects
on operations. Under this definition,
15.5% of hospitals were needy.
The population was adjusted by gender
and age based on average use of primary
care. This weighted older adults and infants
more heavily than younger people and weighted
women more heavily than men. The resulting
variable was an estimate of how many primary
care visits the population would require
in a year’s time. Although the relationship
between use of primary care and need for
services, such as home health or long-term
care, is open to debate, this variable
was simply a way of standardizing the
population based on characteristics known
to affect medical need.
The following variables were selected
for use in the North Carolina analyses:
- Active RNs Employed in the County
per 100,000 Adjusted Population
- Students Enrolled in RN Programs in
the County per 100,000 Adjusted Population
- Number of Short-Term General Hospitals
- Number of Short-Term General Hospital
Beds
- Ratio of Average RN Salary to Median
Income
- Number of Nursing and Personal Care
Facilities
- Percent of Population with Income
Below Poverty Level
- Population per Square Mile
- Ratio of RNs to Hospital Beds
- Number of Hours per Week Paid for
Agency RNs
- Number of Overtime RN Hours per Week
- RN Vacancy Rate
- RN Turnover Rate
- Ratio of LPNs to RNs
- Total Number of Budgeted RN Positions
- Percent Non-Hispanic White
Average values for these variables are
shown in Table 4 for three groups of hospitals
in North Carolina.
Table
4. Average Values of Selected Indicators
for Three Groups of Hospitals in NC
| Indicator |
All
Hospitals |
Hospitals
Reporting No Nurse Staffing Problems |
Hospitals
Reporting Two or More Nurse Staffing
Problems |
| Mean |
S.D. |
Mean |
S.D. |
Mean |
S.D. |
| Active
RNs Employed per 100K Medical Need |
204.2 |
104.7 |
226.0 |
116.1 |
182.7 |
66.5 |
| Students
in RN Programs per 100K Medical Need |
19.7 |
2.6 |
23.8 |
44.3 |
2.6 |
4.7 |
| Number
of Short-term Community Hospitals |
2.0 |
1.8 |
2.3 |
2.0 |
1.4 |
0.6 |
| Number
of Short-term Community Hospital Beds |
679.5 |
75 |
807.2 |
804.4 |
474.4 |
536.2 |
| Ratio
of Average RN Salary to Median Income |
1.5 |
0.3 |
1.4 |
0.29 |
1.6 |
0.3 |
| Number
of Nursing and Personal Care Facilities |
20.1 |
21.7 |
22.7 |
22.98 |
16.1 |
17.9 |
| Percent
of Population Below Poverty Income |
13.0 |
4.2 |
12.5 |
3.88 |
15.25 |
5.1 |
| Population
per Square Mile |
334.4 |
358.8 |
398.9 |
388.1 |
193.9 |
183.5 |
| Ratio
of RNs to Hospital Beds |
0.5 |
0.3 |
0.5 |
0.22 |
0.6 |
0.4 |
| Number
of Hours per Week Paid for Agency
RNs |
2.6 |
3.4 |
2.1 |
3.14 |
2.1 |
2.6 |
| Number
of Overtime RN Hours per Week |
4.94 |
8.2 |
3.8 |
2.66 |
4.5 |
3.4 |
| RN
Vacancy Rate |
6.9 |
4.9 |
6.2 |
4.45 |
9.6 |
5.9 |
| RN
Turnover Rate |
15.5 |
7.8 |
13.5 |
5.73 |
18.9 |
11.8 |
| Ratio
of LPNs to RNs |
0.1 |
0.1 |
0.1 |
0.14 |
0.2 |
0.1 |
| Total
Number of Budgeted RN Positions |
358.6 |
455.3 |
429.7 |
498.7 |
319.1 |
478.1 |
| Percent
Non-Hispanic White |
70.0 |
16.2 |
70.0 |
15.2 |
65.4 |
18.9 |
Population per square mile was very highly
correlated with several other variables,
so a natural log transformation was applied
to reduce problems of multicollinearity.
There was also potential multicollinearity
between the number of RNs per 100,000
adjusted population and number of general
hospital beds per 100,000 adjusted population.
Number of hospital beds was dropped in
favor of number of hospitals.
4. Run OLS Regression Model, Full and
Abbreviated
Two different OLS models were estimated
to predict the number of adverse effects
in hospitals in North Carolina, one for
the full model that included both community
and facility data and one that included
only community data. These models are
summarized below.
Full model
Table
5. Coefficients for Full OLS Regression
Model to Predict Number of Adverse Effects
of Nursing Shortages in Hospitals in North
Carolina
Explanatory
(Independent) Variable |
Unstandardized
Coefficients |
Standardized
Coefficients |
t |
p
Value |
B |
Std
Err |
| Constant |
-0.683 |
3.020 |
- |
-0.226 |
0.822 |
| RNs
per 100,000 Adjusted Need |
-0.0035 |
0.002 |
-0.353 |
-2.002 |
0.052 |
| RN
Salary to Average Salary |
0.518 |
0.707 |
0.132 |
0.732 |
0.468 |
| #
Nursing and Personal Care Facilities |
0.032 |
0.015 |
0.663 |
2.176 |
0.035 |
| %
Population Below Poverty, 2000 |
0.078 |
0.065 |
0.308 |
1.202 |
0.236 |
| RNs
per Hospital Bed |
0.265 |
0.445 |
0.082 |
0.596 |
0.555 |
| Hours
of Agency RNs |
0.0025 |
0.043 |
0.008 |
0.058 |
0.954 |
| Hours
of RN Overtime |
-0.0008 |
0.016 |
-0.007 |
-0.052 |
0.959 |
| RN
Vacancy Rate |
0.032 |
0.032 |
0.142 |
0.985 |
0.330 |
| RN
Turnover Rate |
0.011 |
0.021 |
0.077 |
0.505 |
0.616 |
| Persons
per Square Mile (natural ln) |
0.156 |
0.358 |
0.146 |
0.436 |
0.665 |
| #
Short-term Community Hospitals, ‘01 |
-0.359 |
0.134 |
-0.610 |
-2.690 |
0.010 |
| RN
Students per 100K Adjusted Need |
-0.010 |
0.004 |
-0.392 |
-2.828 |
0.007 |
| %
Population Non-Hispanic White, 2004 |
-0.011 |
0.012 |
-0.167 |
-0.902 |
0.372 |
Dependent Variable: NUM_CONS
Selecting only cases for which FAC_TYPE
= hospital
R2 = 0.429
Abbreviated model
Because most of the variables that appeared
most critical were community variables
rather than facility variables, an abbreviated
model was also run using only community
information. Due to the constraints of
data availability, the abbreviated model
is one that can be used more easily in
practice. The R2, however,
dropped substantially, from 0.429 in the
full model to only 0.177 in the abbreviated
model.
Table
6. Coefficients for Abbreviated OLS Regression
Model to Predict Number of Adverse Effects
of Nursing Shortages in Hospitals in North
Carolina
Dependent Variable: NUM_CONS
Selecting only cases for which FAC_TYPE
= hospital
R2 = 0.177
Coefficients from the full and abbreviated
regression models were used to estimate
predicted number of problems in each facility.
The top 16% of facilities in regard to
predicted number of problems were considered
to have made the test “cut” of 15.5% chosen
arbitrarily based on earlier analysis
(see Step 1). The facilities selected
by the full model and the abbreviated
model were compared to the facilities
whose actual problem scores were in the
top 15.5%.
Using the abbreviated model, 84% of hospitals
were classified correctly based on the
arbitrary value chosen earlier. Eight
percent of facilities were misclassified
as not needy by the abbreviated model
when their actual scores qualified them
as needy, while 7% were misclassified
as being needy when their actual scores
did not qualify them as such.
Using all the information in the full
model would have increased the accuracy
of prediction to 89%, with 5% of facilities
erroneously classified as needy and 5%
erroneously classified as not needy.
Using the information from the testing
in Step 5, we conclude that using an abbreviated
model with widely available community
level data to assign facilities need scores
would result in approximately 84% of facilities
being correctly classified. Supplementing
this with an appeals process requiring
the additional information needed for
the full model would correctly classify
an additional 5% of facilities.
C. Empirical
Models for North Dakota Hospitals
The coefficients estimated for North
Carolina hospitals were applied to hospitals
in North Dakota. The results are summarized
below.
When the coefficients for the abbreviated
model obtained from the empirical models
developed for North Carolina were applied
to hospitals in North Dakota, not surprisingly
the classifications were less accurate.
Seventy-nine percent of North Dakota hospitals
were correctly classified by this application
of North Carolina data, while 10% were
erroneously classified as needy and 10%
were erroneously classified as not needy.
This analysis suggests that using coefficients
based on models estimated in one state
achieves lower accuracy when applied to
facilities in another state. Additional
research would be required to determine
whether the decline in accuracy might
be related to the extent to which general
characteristics of the states are similar
or different.
D. Empirical
Models for North Carolina Nursing Homes
The empirical models for nursing homes
in North Carolina are summarized below.
The indicator of nursing shortage used
as a dependent variable was the number
of reported effects on operations reported
by a facility. Most facilities reported
no effects or only one effect. The mean
value for all facilities was 1.0, with
a standard deviation of 1.1. Based on
this, we defined facilities as being needy
(for test purposes only) if they reported
two or more effects on operations. Under
this definition, 31.3% of nursing homes
were needy.
The population was adjusted by gender
and age based on average use of primary
care. This weighted older adults and infants
more heavily than younger people and women
more heavily than men. The resulting variable
was an estimate of how many primary care
visits the population would require in
a year’s time. Although the relationship
between use of primary care and need for
services such as home health or long-term
care is open to debate, this variable
was simply a way of standardizing the
population based on characteristics known
to affect medical need.
- Active RNs employed in the county
per 100,000 adjusted population
- Students enrolled in RN programs in
the county per 100,000 adjusted population
- Number of short-term general hospitals
- Number of short-term general hospital
beds
- Ratio of average RN salary to median
income
- Number of nursing and personal care
facilities
- Percent of the population with income
below poverty level
- Population per square mile
- Ratio of RNs to hospital beds
- Number of hours per week paid for
agency RNs
- Number of overtime RN hours per week
- RN vacancy rate
- RN turnover rate
- Ratio of LPNs to RNs
- Total number of budgeted RN positions
- Percent non-Hispanic white
Table
7. Means and Standard Deviations of Selected
Independent Variables Related to Nursing
Shortages in North Carolina Nursing Homes
| Independent
Variables |
All
Nursing Homes |
Nursing
Homes Reporting No Nurse Staffing
Problems |
Nursing
Homes Reporting Two or More Nurse
Staffing Problems |
| Mean |
S.D. |
Mean |
S.D. |
Mean |
S.D. |
| Active
RNs Employed in County per 100K Medical
Need |
189.6 |
101.1 |
204.9 |
111.2 |
207.3 |
87.5 |
| Students
in RN Programs per 100K Medical Need |
36.0 |
139.9 |
29.6 |
65.8 |
18.1 |
30.8 |
| Number
of Short-Term Community Hospitals |
1.7 |
1.6 |
2.1 |
2.0 |
1.5 |
1.2 |
| Number
of Short-Term Community Hospital Beds |
597.9 |
689.3 |
740.5 |
780.3 |
704.5 |
654.9 |
| Ratio
of average RN salary to median income |
1.5 |
0.3 |
1.5 |
0.3 |
1.4 |
0.3 |
| Number
of Nursing and Personal Care Facilities |
18.4 |
19.6 |
22.9 |
23.0 |
22.3 |
18.8 |
| Percent
of Population w/ Income Below Poverty
Level |
13.0 |
4.1 |
12.9 |
4.1 |
12.5 |
3.9 |
| Population
per Square Mile |
300.0 |
315.0 |
357.4 |
373.2 |
351.6 |
278.9 |
| Ratio
of RNs to Hospital Beds |
0.5 |
0.3 |
0.4 |
0.2 |
0.5 |
0.2 |
| Hours
per Week Paid for Agency RNs |
2.1 |
5.9 |
2.5 |
7.9 |
3.8 |
9.4 |
| Number
of Overtime RN Hours per Week |
6.5 |
9.7 |
12.4 |
11.1 |
14.1 |
13.3 |
| RN
Vacancy Rate |
9.5 |
13.6 |
8.5 |
12.2 |
9.7 |
13.1 |
| RN
Turnover Rate |
29.6 |
43.6 |
40.7 |
69.3 |
38.8 |
32.8 |
| Ratio
of LPNs to RNs |
1.3 |
2.2 |
2.2 |
1.5 |
3.1 |
4.3 |
| Total
Number of Budgeted RN Positions |
79.1 |
240.8 |
7.2 |
4.6 |
7.0 |
4.9 |
| Percent
Non-Hispanic White |
70.9 |
16.4 |
70.4 |
17.5 |
70.2 |
15.1 |
Population per square mile was very highly
correlated with several other variables,
and so a log transformation was applied
to avoid problems with multicollinearity.
There was also potential multicollinearity
between the number of RNs per 100,000
adjusted population, and number of general
hospital beds per 100,000 adjusted population.
Number of hospital beds was dropped in
favor of number of hospitals.
The following regression was run for
nursing homes in North Carolina:
Table
8. Coefficients for OLS Regression Model
to Predict Number of Adverse Effects of
Nursing Shortages in Nursing Homes in
North Carolina
| Independent
Variable |
Unstandardized
Coefficients |
Standardized
Coefficients |
t |
p
Value |
| B |
Std
Err |
Beta |
(Constant) |
-2.395 |
2.872 |
- |
-0.834 |
0.407 |
| RNs
per 100,000 Adjusted Need |
-0.0007 |
0.002 |
-0.063 |
-0.379 |
0.706 |
| RN
Salary to Average Salary |
-1.307 |
0.779 |
-0.338 |
-1.677 |
0.098 |
| #
Nursing/Personal Care Facilities |
-0.00338 |
0.012 |
-0.060 |
-0.271 |
0.787 |
| %
Population Below Poverty, 2000 |
0.114 |
0.067 |
0.393 |
1.690 |
0.095 |
| RNs
per Hospital Bed |
0.585 |
0.637 |
0.110 |
0.919 |
0.361 |
| Hours
of Agency RNs |
0.0051 |
0.016 |
0.040 |
0.314 |
0.754 |
| Hours
of RN Overtime |
0.0073 |
0.012 |
0.070 |
0.599 |
0.551 |
| RN
Vacancy Rate |
-0.0014 |
0.011 |
-0.014 |
-0.131 |
0.896 |
| RN
Turnover Rate |
0.0002 |
0.002 |
0.012 |
0.095 |
0.925 |
| Persons
per Square Mile (Natural ln) |
0.632 |
0.330 |
0.494 |
1.914 |
0.059 |
| #
Short-Term Commun Hospitals, ‘01 |
-0.344 |
0.119 |
-0.485 |
-2.881 |
0.005 |
| RN
Students per 100,000 Adjusted Need
|
0.0010 |
0.003 |
0.047 |
0.385 |
0.701 |
| %
Population White Non-Hispanic, 2004 |
0.014 |
0.012 |
0.199 |
1.160 |
0.250 |
Dependent Variable: NUM_CONS
Selecting only cases for which FAC_TYPE
= long-term care
R2 = 0.20
This model had little predictive value,
perhaps because the chosen dependent measure
of nursing shortage was inappropriate
for nursing homes, which rely heavily
on LPNs. The question about the effects
of a nursing shortage on facility operations
did not specify RN shortages, and so it
seemed plausible that significant relationships
were not emerging based on RN variables
because respondents answered this question
primarily thinking of LPNs.
Therefore, in estimating this model,
the decision was made to revert to RN
vacancy rates, acknowledging that the
facilities reporting the highest vacancy
rates are not necessarily the facilities
suffering the most from the RN shortage.
Several variables relating to the LPN
job market were also included in this
second version of the model. The mean
RN vacancy rate for nursing homes was
10.6, with a standard deviation of 15.8.
On this basis, we classified any facility
with a RN vacancy rate of more than 26.4
as “needy” as a test value (11.9% of facilities).
An alternate OLS regression model was
estimated for RN Vacancy Rates in nursing
homes in North Carolina (Table 9). It
focused more on LPNs and less on RNs,
which better reflects the actual staffing
patterns at nursing homes.
Table
9. Coefficients for Alternate OLS Regression
Model to Predict RN Vacancy Rates in Nursing
Homes in North Carolina
| Independent
Variables |
Unstandardized
Coefficients |
Standardized
Coefficients |
t |
p
Value |
B |
Std.
Error |
Beta |
(Constant) |
-15.65 |
18.185 |
- |
-0.861 |
0.392 |
| RNs
per 100,000 Adjusted Need |
0.032 |
0.022 |
0.234 |
1.444 |
0.152 |
| RN
Salary to Average Salary |
13.83 |
6.945 |
0.316 |
1.992 |
0.049 |
| #
Nursing/Personal Care Facilities |
-0.215 |
0.127 |
-0.320 |
-1.687 |
0.095 |
| %
Population Below Poverty, 2000 |
-0.939 |
0.460 |
-0.276 |
-2.039 |
0.044 |
| RNs
per Hospital Bed |
-9.236 |
5.976 |
-0.161 |
-1.545 |
0.126 |
| Hours
of Agency RNs |
-0.281 |
0.165 |
-0.182 |
-1.704 |
0.092 |
| Hours
of RN Overtime |
0.138 |
0.114 |
0.116 |
1.214 |
0.228 |
| RN
Turnover Rate |
0.027 |
0.026 |
0.117 |
1.063 |
0.291 |
| Persons
per Square Mile (natural log) |
1.824 |
2.768 |
0.120 |
0.659 |
0.512 |
| #
Short-Term Community Hospitals, ‘01 |
0.840 |
1.257 |
0.104 |
0.669 |
0.506 |
| LPN
Vacancy Rate |
0.356 |
0.083 |
0.401 |
4.287 |
0.000 |
| LPNs
per 100,000 Adjusted Need |
-0.080 |
0.108 |
-0.090 |
-0.740 |
0.461 |
| LPNs
per RN |
1.126 |
0.402 |
0.257 |
2.801 |
0.006 |
| LPN
Turnover Rate |
0.050 |
0.040 |
0.128 |
1.274 |
0.206 |
Dependent Variable: RNVacRate
Selecting only cases for which FAC_TYPE
= long-term care
R2 = 0.35
Coefficients from the regression model
were used to estimate predicted number
of problems in each facility. The top
31.5% of facilities in regard to predicted
number of problems were considered to
have made the test “cut” of 31.3% chosen
arbitrarily based on earlier analysis
(see Step 1). The facilities selected
by the full model were compared to the
facilities whose actual problem scores
were in the top 31.3%.
Using the full model, only 73% of nursing
homes were classified correctly based
on the arbitrary value chosen earlier.
Fourteen percent of facilities were misclassified
as not needy by the model when their actual
scores qualified them as needy, while
12% were misclassified as being needy
when their actual scores did not qualify
them as such.
The alternate model, however, proved
very effective in identifying facilities
with the highest RN vacancy rates. Eighty-eight
percent of facilities were correctly classified
as “needy” based on the arbitrary value
chosen earlier. Seven percent were misclassified
as not needy by the model when their actual
scores qualified them as needy, while
6% were misclassified as being needy when
their actual scores did not qualify them
as such.
Although there are several reliable indicators
of high RN vacancy rates in nursing homes,
there is little that predicts need in
terms of the problems facilities report
in their operations as a result of the
nursing shortage. This is problematic
because the facilities reporting the highest
vacancy rates are not necessarily the
facilities suffering the most from nursing
shortages. Indeed, RN vacancy rates were
unrelated to reports of shortage problems.
The facilities the majority of facilities
defined as needy on the basis of reported
problems were not the same facilities
defined as needy on the basis of RN vacancy
rates. This may be due to the prominence
of LPNs in long-term care, however, causing
most people to answer the question about
problems based on LPN shortages rather
than RN shortages. Given this ambiguity,
RN vacancy rates may be the better indicator
of long-term care shortages.
Another shortcoming of the analyses is
that population is standardized based
on primary care utilization rates estimated
by age and gender. This formula may be
inappropriate for estimating long-term
care need in the population, and perhaps
a new formula for standardization based
on long-term care utilization rates should
be introduced. A standardization of the
population that is tailored to long-term
care might produce more useful models
and more reliable estimates of community
need. Number of long-term care beds and
beds per older adults would also be useful
information to include in future attempts
to model.
E. Tailoring
for Long-Term Care
As stated in the Conclusion section of
Part I, the initial analyses were based
on a general model tested for four types
of facilities: hospitals, home health
agencies, public health agencies, and
long-term care facilities. For the former
three types of facilities, indicators
of general medical need and availability
of general medical services may be relevant
indicators in judging adequacy of the
RN supply. Long-term care, however, is
a more specific type of care provided
to a narrower segment of the population.
When the alternate model obtained in
Part I of the pilot testing was applied
to nursing homes in North Dakota , the
classifications were considerably less
accurate. This is the same result as observed
for hospitals.
2. Conclusion
As was the case for hospitals, this analysis
suggests that using coefficients based
on long-term care models estimated in
one state achieves lower accuracy when
applied to facilities in another state.
Additional research would be required
to determine whether the decline in accuracy
might be related to the extent to which
general characteristics of the states
are similar or different.
F. Empirical
Models for North Carolina Home Health
Agencies
The steps used to estimate the empirical
models for home health agencies in North
Carolina are summarized below.
The indicator of nursing shortage used
as a dependent variable was the number
of reported effects on operations reported
by an agency. Most agencies reported no
effects or only one effect. The mean value
for all agencies was 0.8, with a standard
deviation of 1.0. Based on this, we defined
agencies as being needy (for test purposes
only) if they reported two or more effects
on operations. Under this definition,
19.4% of home health agencies were needy.
The population was adjusted by gender
and age based on average use of primary
care. This weighted older adults and infants
more heavily than younger people and weighted
women more heavily than men. The resulting
variable was an estimate of how many primary
care visits the population would require
in a year’s time. Although the relationship
between use of primary care and need for
services such as home health or long-term
care is open to debate, this variable
was simply a way of standardizing the
population based on characteristics known
to affect medical need.
- Active RNs employed in the county
per 100,000 adjusted population
- Students enrolled in RN programs in
the county per 100,000 adjusted population
- Number of short-term general hospitals
- Number of short-term general hospital
beds
- Ratio of average RN salary to median
income
- Number of nursing and personal care
facilities
- Percent of the population with income
below poverty level
- Population per square mile
- Ratio of RNs to hospital beds
- Number of hours per week paid for
agency RNs
- Number of overtime RN hours per week
- RN vacancy rate
- RN turnover rate
- Ratio of LPNs to RNs
- Total number of budgeted RN positions
- Percent non-Hispanic white
Table
10. Means and Standard Deviations of Selected
Independent Variables Related to Nursing
Shortages in North Carolina Home Health
Agencies
| Independent
Variable |
All
Home Health Agencies |
Agencies
Reporting No Nurse Staffing Problems |
Agencies
Reporting Two or More Nurse Staffing
Problems |
| Mean |
S.D. |
Mean |
S.D. |
Mean |
S.D. |
| Active
RNs in County per 100K Medical Need |
184.6 |
98.0 |
187.2 |
102.4 |
187.5 |
95.4 |
| Students
in RN Programs per 100K Medical Need |
48.7 |
195.8 |
54.6 |
230.8 |
39.5 |
75.6 |
| Number
of Short-Term Community Hospitals |
1.7 |
1.4 |
1.7 |
1.4 |
1.8 |
1.7 |
| Number
of Short-Term Community Hospital Beds |
555.8 |
655.4 |
590.2 |
693.9 |
617.2 |
679.9 |
| Ratio
of Average RN Salary to Median Income |
1.5 |
1.4 |
1.5 |
0.3 |
1.5 |
0.3 |
| Number
of Nursing and Personal Care Facilities |
16.8 |
17.3 |
17.3 |
17.8 |
20.1 |
20.4 |
| Percent
of Population w/ Income Below Poverty
Level |
12.6 |
4.1 |
12.6 |
4.0 |
13.5 |
4.8 |
| Population
per Square Mile |
287.6 |
283.5 |
292.3 |
287.8 |
312.6 |
331.8 |
| Ratio
of RNs to Hospital Beds |
0.5 |
0.3 |
0.4 |
0.3 |
0.5 |
0.2 |
| Number
of Hours per Week Paid for Agency
RNs |
1.7 |
4.9 |
1.2 |
3.4 |
4.7 |
9.2 |
| Number
of Overtime RN Hours per Week |
2.7 |
4.3 |
2.3 |
3.7 |
5.0 |
6.6 |
| RN
Vacancy Rate |
10.1 |
15.9 |
7.6 |
14.1 |
21.5 |
21.2 |
| RN
Turnover Rate |
28.3 |
37.4 |
19.1 |
24.9 |
60.4 |
52.9 |
| Ratio
of LPNs to RNs |
0.3 |
0.3 |
0.3 |
0.3 |
0.3 |
0.2 |
| Total
Number of Budgeted RN Positions |
12.0 |
10.5 |
12.5 |
11.5 |
10.7 |
7.9 |
| Percent
Non-Hispanic White |
72.7 |
16.4 |
73.5 |
15.8 |
63.2 |
19.0 |
Population per square mile was very highly
correlated with several other variables,
and so a log transformation was applied
to avoid problems with multicollinearity.
There was also potential multicollinearity
between the number of RNs per 100,000
adjusted population, and number of general
hospital beds per 100,000 adjusted population.
Number of hospital beds was dropped in
favor of number of hospitals.
The following regression was run for
home health agencies in North Carolinas:
Table
11. Coefficients for OLS Regression Model
to Predict Number of Adverse Effects of
Nursing Shortages in Home Health Agencies
in NC
Independent
Variable |
Unstandardized
Coefficients |
Standardized
Coefficients |
t |
p
Value |
| B |
Std
Err |
Beta |
| (Constant) |
2.270 |
2.216 |
- |
1.024 |
0.310 |
| RNs
per 100,000 Adjusted Need |
0.0022 |
0.002 |
0.214 |
1.412 |
0.163 |
| RN
salary to Average Salary |
1.570 |
0.607 |
0.480 |
2.587 |
0.012 |
| #
Nursing/Personal Care Facilities |
0.014 |
0.013 |
0.255 |
1.137 |
0.260 |
| %
Population Below Poverty, 2000 |
-0.118 |
0.052 |
-0.519 |
-2.266 |
0.027 |
| RNs
per Hospital Bed |
-0.200 |
0.337 |
-0.062 |
-0.594 |
0.555 |
| Hours
of Agency RNs |
0.046 |
0.022 |
0.232 |
2.069 |
0.043 |
| Hours
of RN overtime |
-0.011 |
0.030 |
-0.041 |
-0.369 |
0.713 |
| RN
Vacancy Rate |
0.024 |
0.008 |
0.374 |
3.078 |
0.003 |
| RN
Turnover Rate |
0.0069 |
0.003 |
0.265 |
2.339 |
0.023 |
| Persons
per Square Mile (natural log) |
-0.436 |
0.290 |
-0.392 |
-1.502 |
0.139 |
| #
Short-Term Community Hospitals, ‘01 |
-0.020 |
0.116 |
-0.027 |
-0.170 |
0.865 |
| RN
Students per 100K Adjusted Need |
-0.00088 |
0.001 |
-0.202 |
-1.605 |
0.114 |
| %
Population White Non-Hispanic, 2004 |
-0.0136 |
0.010 |
-0.230 |
-1.340 |
0.185 |
Dependent Variable: NUM_CONS
Selecting only cases for which FAC_TYPE
= home health
R2 = 0.44
An abbreviated model was also estimated.
It appeared to have little value for home
health agencies because most of the variables
that appeared most critical were facility
variables rather than community variables,
and would have to be collected directly
from facilities. Variables that were “optional,”
and were able to be dropped for an abbreviated
model were the variables most widely available.
Coefficients from the full regression
model were used to estimate predicted
number of problems in each agency. The
top 19.2% of agencies in regard to predicted
number of problems were considered to
have made the test “cut” of 19.4% chosen
arbitrarily based on earlier analysis
(see Step 1). The agencies selected by
the full model were compared to the agencies
whose actual problem scores were in the
top 19.4%.
Using the full model, 85% of home health
agencies were classified correctly based
on the arbitrary value chosen earlier.
Seven percent of agencies were misclassified
as not needy by the model when their actual
scores qualified them as needy, while
8% were misclassified as being needy when
their actual scores did not qualify them
as such.
Using the information from the testing
in Step 5, we can conclude that using
the full model with both widely available
community level data and data collected
directly from agencies to assign need
scores would result in approximately 85%
of agencies being correctly classified.
The importance of the facility-level variables
in the model, however, means that any
effective strategy for classifying home
health agencies will require the collection
of data on factors such as turnover and
vacancy rates.
As with long-term care facilities, however,
there was an issue in using a model designed
to incorporate measures of general medical
need. Home health is not primary care,
and patients tend to be predominantly
older while both the oldest and the youngest
segments of the population disproportionately
consume primary care. A standardization
of the population that is tailored to
long-term care utilization might produce
more useful models and more reliable estimates
of community need. While reliable community-level
data on home health capacity will not
be obtainable, number of long-term care
beds and beds per older adult might also
be useful information to include in future
attempts to model, both because long-term
care serves similar populations to home
health, and because long-term care and
home health may compete for the same pool
of RNs. Incorporation of such variables
may make community-level indicators more
useful in evaluating home health shortages,
possible enabling the construction of
a reliable abbreviated model as was done
for hospitals.
G. Empirical
Models for North Dakota Home Health Agencies
The coefficients estimated for North
Carolina home health agencies were applied
to home health agencies in North Dakota.
The results are summarized below.
When the model obtained in Part I of
the pilot testing was applied to home
health agencies in North Dakota , the
classifications were considerably less
accurate. This is the same result as observed
for hospitals and long-term care facilities.
As was the case for hospitals, this analysis
suggests that using coefficients based
on home health agencies models estimated
in one state achieves lower accuracy when
applied to facilities in another state.
Additional research would be required
to determine whether the decline in accuracy
might be related to the extent to which
general characteristics of the states
are similar or different.
H. Empirical
Models for North Carolina Public Health
Agencies
The steps used to estimate the empirical
models for public health agencies in North
Carolina are summarized below.
The indicator of nursing shortage used
as a dependent variable was the number
of reported effects on operations reported
by an agency. Most agencies reported no
effects or only one effect. The mean value
for all agencies was 1.09, with a standard
deviation of 1.03. Based on this, we defined
agencies as being needy (for test purposes
only) if they reported two or more effects
on operations, or more than one standard
deviation above the mean. Under this definition,
26.5% of public health agencies were needy.
The population was adjusted by gender
and age based on average use of primary
care. This weighted older adults and infants
more heavily than younger people and weighted
women more heavily than men. The resulting
variable was an estimate of how many primary
care visits the population would require
in a year’s time. Although the relationship
between use of primary care and need for
services such as home health or long-term
care is open to debate, this variable
was simply a way of standardizing the
population based on characteristics known
to affect medical need.
- Active RNs employed in the county
per 100,000 adjusted population
- Students enrolled in RN programs in
the county per 100,000 adjusted population
- Number of short-term general hospitals
- Number of short-term general hospital
beds
- Ratio of average RN salary to median
income
- Number of nursing and personal care
facilities
- Percent of the population with income
below poverty level
- Population per square mile
- Ratio of RNs to hospital beds
- Number of hours per week paid for
agency RNs
- Number of overtime RN hours per week
- RN vacancy rate
- RN turnover rate
- Ratio of LPNs to RNs
- Total number of budgeted RN positions
- Percent non-Hispanic white
Table
12. Means and Standard Deviations of Selected
Independent Variables Related to Nursing
Shortages in North Carolina Public Health
Agencies
| Independent
Variables |
All
Public Health Agencies |
Agencies
Reporting No Nurse Staffing Problems |
Agencies
Reporting Two or More Nurse Staffing
Problems |
| Mean |
S.D. |
Mean |
S.D. |
Mean |
S.D. |
| Active
RNs in County per 100K Medical Need |
155.6 |
92.2 |
148.5 |
82.5 |
162.6 |
109.6 |
| Students
in RN Programs per 100K Medical Need |
61.9 |
220.1 |
90.9 |
277.8 |
16.8 |
26.24 |
| Number
of Short-Term Community Hospitals |
1.2 |
1.1 |
1.2 |
1.2 |
1.1 |
0.6 |
| Number
of Short-Term Community Hospital Beds |
343.1 |
488.3 |
242.2 |
378.8 |
380.0 |
386.1 |
| Ratio
of Average RN Salary to Median Income |
1.6 |
0.3 |
1.6 |
0.3 |
1.6 |
0.3 |
| Number
of Nursing and Personal Care Facilities |
10.9 |
13.3 |
8.8 |
11.3 |
12.3 |
10.4 |
| Percent
of Population w/ Income Below Poverty |
14.0 |
4.1 |
14.1 |
3.9 |
14.8 |
4.5 |
| Population
per Square Mile |
184.2 |
218.2 |
158.8 |
210.8 |
200.3 |
198.3 |
| Ratio
of RNs to Hospital Beds |
0.5 |
0.4 |
0.4 |
0.3 |
0.5 |
0.5 |
| Number
of Hours per Week Paid for Agency
RNs |
0.9 |
2.9 |
0.9 |
3.2 |
1.7 |
3.4 |
| Number
of Overtime RN Hours per Week |
0.8 |
2.4 |
0.7 |
2.2 |
1.6 |
3.4 |
| RN
Vacancy Rate |
9.0 |
11.6 |
8.6 |
12.2 |
10.2 |
10.2 |
| RN
Turnover Rate |
15.5 |
18.7 |
16.9 |
22.3 |
15.2 |
11.4 |
| Ratio
of LPNs to RNs |
0.1 |
0.2 |
0.1 |
0.2 |
0.1 |
0.1 |
| Total
Number of Budgeted RN Positions |
26.6 |
27.6 |
22.9 |
26.4 |
26.4 |
17.1 |
| Percent
Non-Hispanic White |
71.1 |
17.1 |
73.3 |
63.9 |
63.9 |
16.8 |
Population per square mile was very highly
correlated with several other variables,
and so a log transformation was applied
to avoid problems with multicollinearity.
There was also potential multicollinearity
between the number of RNs per 100,000
adjusted population, and number of general
hospital beds per 100,000 adjusted population.
Number of hospital beds was dropped in
favor of number of hospitals.
The following regression was run for
public health agencies.
Table
13. Coefficients for Full OLS Regression
Model to Predict Number of Adverse Effects
of Nursing Shortages in Public Health
Agencies in NC
| Independent
Variable |
Unstandardized
Coefficients |
Standardized
Coefficients |
t |
p
Value |
| B |
Std.
Error |
Beta |
| (Constant) |
2.183 |
2.839 |
- |
0.769 |
0.447 |
| RNs
per 100,000 Adjusted Need |
-0.0013 |
0.002 |
-0.123 |
-0.639 |
0.527 |
| RN
Salary to Average Salary |
0.408 |
0.864 |
0.088 |
0.473 |
0.639 |
| #
Nursing/Personal Care Facilities |
0.017 |
0.034 |
0.118 |
0.517 |
0.608 |
| %
Population Below Poverty, 2000 |
-0.066 |
0.056 |
-0.276 |
-1.176 |
0.247 |
| RNs
per Hospital Bed |
0.578 |
0.619 |
0.159 |
0.934 |
0.356 |
| Hours
of Agency RNs |
0.0386 |
0.075 |
0.080 |
0.516 |
0.609 |
| Hours
of RN Overtime |
0.0905 |
0.057 |
0.227 |
1.585 |
0.121 |
| RN
Vacancy Rate |
0.0282 |
0.014 |
0.353 |
1.979 |
0.055 |
| RN
Turnover Rate |
0.0041 |
0.007 |
0.088 |
0.555 |
0.582 |
| Persons
per Square mile (natural log) |
0.190 |
0.353 |
0.162 |
0.537 |
0.594 |
| #
Short-Term Community Hospitals 2001 |
-0.352 |
0.287 |
-0.250 |
-1.228 |
0.227 |
| RN
Students per 100K Adjusted Need |
-0.0015 |
0.001 |
-0.409 |
-2.321 |
0.026 |
| %
Population White Non-Hispanic, ‘04 |
-0.024 |
0.011 |
-0.404 |
-2.179 |
0.036 |
Dependent Variable: NUM_CONS
Selecting only cases for which FAC_TYPE
= public health
R2 of 0.34
Because most of the variables that appeared
most critical were community variables
rather than facility variables, an abbreviated
model was also run using only community
information. Due to general constraints
of data availability, the abbreviated
model is one that can be used more realistically
in practice. The following regression
was run for public health agencies, with
an R2 of 0.30, which is only
slightly smaller than the R2
for the full model.
Table
14. Coefficients for Reduced OLS Regression
Model to Predict Number of Adverse Effects
of Nursing Shortages in Public Health
Agencies in NC
| Independent
Variable |
Unstandardized
Coefficients |
Standardized
Coefficients |
t |
p
Value |
| B |
Std.
Error |
Beta |
| (Constant) |
3.607 |
2.172 |
- |
1.661 |
0.102 |
| RNs
per 100,000 Adjusted Need |
-0.00085 |
0.002 |
-0.074 |
-0.405 |
0.687 |
| RN
Salary to Average Salary |
0.571 |
0.612 |
0.146 |
0.932 |
0.355 |
| #
Nursing/Personal Care Facilities 2000 |
0.037 |
0.030 |
0.400 |
1.236 |
0.221 |
| Percent
of Population Below Poverty, 2000 |
-0.086 |
0.051 |
-0.338 |
-1.684 |
0.098 |
| Ratio
of RNs to Beds |
0.365 |
0.444 |
0.116 |
0.822 |
0.415 |
| Ln
Population Density |
-0.084 |
0.262 |
-0.072 |
-0.321 |
0.750 |
| #
Short-Term Community Hospitals ‘01 |
-0.430 |
0.174 |
-0.441 |
-2.468 |
0.017 |
| RN
Students per 100,000 Adjusted Need |
-0.00087 |
0.001 |
-0.203 |
-1.675 |
0.099 |
| Number
of Hospital Beds |
0.00033 |
0.001 |
0.124 |
0.360 |
0.720 |
| Percent
White Non-Hispanic, 2004 |
-0.0246 |
0.010 |
-0.412 |
-2.525 |
0.014 |
Dependent Variable: NUM_CONS
Selecting only cases for which FAC_TYPE
= public health
R2 of 0.30
Coefficients from the full regression
model were used to estimate predicted
numbers of problems in each agency. The
top 27.2% of agencies in regard to predicted
numbers of problems were considered to
have made the test cut of 26.5%, chosen
arbitrarily, based on earlier analysis
(see Step 1). The agencies selected by
the full model were compared to the agencies
whose actual problem scores were in the
top 26.5%.
Using the full model, 25% of public health
agencies were not classified correctly
based on the arbitrary value chosen earlier.
About 14% of agencies were misclassified
as not needy by the model when their actual
scores qualified them as needy, while
about 12% were misclassified as being
needy when their actual scores did not
qualify them as such.
The full model provided relatively poor
predictive value, suggesting that an abbreviated
version of the full model was not worth
pursuing for public health agencies.
Although there are significant predictors
of problems related to nursing shortages
in public health agencies, the full regression
model has a high degree of error in predicting
which agencies report the greatest problems.
This model does not seem effective to
estimate RN shortages in public health
agencies. More information may be needed
to assess the roles of RNs in public health
and the consequences of inabilities to
fill RN positions.
I. Empirical
Models for North Dakota Public Health
Agencies
The coefficients estimated for North
Carolina public health agencies were applied
to public health agencies in North Dakota.
The results are summarized below.
When the abbreviated model obtained in
Part I of the pilot testing was applied
to public health agencies in North Dakota,
the classifications were considerably
less accurate. This was the same result
observed for hospitals, long-term care
facilities, and home health agencies.
As was the case for hospitals, long-term
care facilities, and home health agencies,
this analysis suggested that using coefficients
based on long-term care models estimated
in one state achieves lower accuracy when
applied to facilities in another state.
Additional research would be required
to determine whether the decline in accuracy
might be related to the extent to which
general characteristics of the states
are similar or different.
J. Ordered
Probit Models for North Carolina
Although it is possible (as demonstrated
in the analyses in the previous section)
to use OLS regression to estimate the
relationships between a set of independent
explanatory variables and an ordinal dependent
variable like “difficulty recruiting RNs,”
the fact that the dependent variable was
ordinal and not Gaussian violates one
of the underlying assumptions of OLS regression.
One way to address this violation is to
use an alternate regression technique,
ordered probit analysis. This technique
is similar in concept to OLS regression,
but uses very different computational
procedures. Most important, however, it
is designed to work effectively with ordinal
dependent variables.
Two different ordered probit models were
developed to identify the factors related
to difficulty recruiting RNs in the four
types of facilities in North Carolina.
The first analyzes all four types of facilities
simultaneously. The second analyzes the
four different types of facilities separately;
i.e., hospitals, home health facilities,
long-term care facilities, and public
health facilities. Both models included
variables that represent community characteristics
and facility characteristics. The community
variables were divided into three groups
– demographic, economic, and nursing variables.
For each type of facility, the variables
included in the model were based on p-values.
The lower the p-value of a variable, the
stronger the influence the variable had
on the nurse recruiting. In other words,
lower p-values meant better prediction
of difficulty recruiting RNs; therefore
variables with lower p-value were included
in the model. If p-value was lower than
0.10 then the variable was statistically
significant in explaining the shortage
at the 10% level of significance.
In this technique, dummy variables for
the types of facilities reflect the effects
of facility type. By creating interaction
variables (which are the products of the
dummy variables with other independent
variables), this technique provides coefficient
estimates for all four types of facilities
(hospitals, home health care, long-term
care, and public health). The coefficient
for an independent variable for one type
of facility may be different from the
coefficients for the other facility types.
In addition, an independent variable may
be statistically significant in explaining
the recruiting difficulty for one type
of facility, but not for another.
The advantage of estimating the model
based on all facilities together was that
the predicted recruiting difficulty scores
were comparable not only within the same
type of facility, but also across facilities
of different types. The variables included
in the model are shown in Table 15. Each
variable in the table was statistically
significant for at least one type of facility.
Table 16 presents the coefficient estimates
for the simultaneous model. The table
shows that different types of facilities
had different sets of independent variables
and therefore different sets of coefficient
estimates. For example, the variables
selected for hospitals were: metropolitan
area, proportion of American Indian and
Alaska Native (AIAN), income per capita,
number of hospices per 10,000 individuals,
a dummy if the county had a hospital with
a nursing school, number of hospital full
time persons per 10 individuals, facility
type, total number of budgeted RN positions,
RN vacancy rate, total number of budgeted
LPN positions, and RN turnover rate.
The coefficient estimates were used to
calculate a predicted nursing recruitment
difficulty score for each facility type
(as similar to the OLS models). These
predicted nursing recruitment difficulty
scores were used to create groups of facilities
with different predicted levels of difficulty
(Table 17).
At least three indicators can be used
to measure the goodness of fit of the
estimated model in explaining the difficulty
recruiting RNs. The first is based on
the significance levels of the independent
variables included in the model. Lower
p-values mean a better estimated model.
The fact that many of the p-values for
many of the variables in the model are
less than 0.10 (bolded values) means the
model is a good one (Table 16).
A second indicator of goodness of fit
is based on a cross tabulation of the
actual recruiting difficulty indicator
for facilities obtained from the original
survey data by the recruiting difficulty
indicator based predicted by the
model (Table 17). If all off-diagonal
values in this table were zero, the model
would perfectly explain the difficulty
in recruiting RNs. A statistical test
of goodness of fit can be computed based
on this cross tabulation based on the
Spearman Rank Order Correlation. This
tests the null hypothesis that there is
no correlation between actual recruitment
difficulty and the predicted recruitment
difficulty. Table 17 shows that the Spearman
Correlation coefficient is 0.53, which
is statistically significantly different
from 0 (p < 0.0005). This is a second
reason to trust this model, although a
higher correlation coefficient would make
the model even stronger.
Table
15. Variables, Source of Data, and Year
of Independent Variables in Ordered Probit
Model for North Carolina for 2004
Facility variables
- Type of facility (hospital
setting, home health setting,
long-term care setting, and public
health setting). [North Carolina
Center for Nursing (NCCN), 2004]
- Total number of budgeted RN
positions/100, representing the
size of a facility. (NCCN, 2004)
- Number of RN vacant FTE/100.
[NCCN, 2004]
- Total number of budgeted LPN
positions/100, representing other
profession as a substitute for
RNs in a facility. [NCCN, 2004]
- Number of LPN vacant FTE/100.
[NCCN, 2004]
- RN turnover/100, representing
the quality of management of a
facility. [NCCN, 2004]
Community variables:
Demographic conditions in the county
where the facility is located
- Indicator of metropolitan area
representing the rural/urban.
[ARF, 2003]
- Proportion of population age
less than 5 years*10. [ARF, 2000]
- Proportion of population age
20 to 65 years. [ARF, 2000]
- Proportion of population older
than 65 years. [ARF, 2000]
- Proportion of non-Hispanic
White population. [ARF, 2002]
- Proportion of Hispanic population*10.
[ARF, 2002]
- Proportion of non-Hispanic
Black population. [ARF, 2002]
- Proportion of AIAN population*10.
[ARF, 2002]
Economic conditions in the county
where the facility is located
- Income per capita/10000. [ARF,
2001]
- Percentage of population in
poverty. [ARF, 2001]
- Total Medicaid inpatient days
per population. [ARF, 2002]
- Total Medicaid inpatient days
per population. [ARF, 2002]
Nurse-related conditions in the
county where the facility is located
- Number of RNs per 100 individuals.
[ARF, 2000]
- Number of medical records and
health information technologists
per 1,000 individuals as a proxy
for market conditions of other
health professionals. [ARF, 2000]
- Number of hospital per 10,000
individuals. [ARF, 2002]
- Number of Hospices per 10,000
individuals. [ARF, 2002]
- Indicator for county having
a hospital with nursing school.
[ARF, 2002]
- Number of hospital full time
personals per 10 individuals.
[ARF, 2002]
- Number of nursing home full
time personals per 1,000 individuals.
[ARF, 2002]
- Ratio of average RN salary
to median income. [Census, 2000]
|
The third goodness of fit indicator is
pseudo-R2, the McKelvey-Zavoina
R2. The higher the value of
this pseudo-R2, the better
the accuracy of the model. The value of
0.71 for this statistic shown in Table
16 is high for this kind of model, another
indicator that this model is a good one.
Figure 11 presents the distribution of
predicted shortage scores for all facilities.
The range of the nursing shortage scores
for facilities facing difficulty in recruiting
RNs was much higher than those for facilities
not facing difficulty in recruiting RNs.
These predicted values showed that the
number of facilities facing difficulty
in recruiting RNs was 141 (43.4%), and
the number of facilities not facing difficulty
in recruiting RNs was 30 (9.2%).
Figure
11. Distribution of the Predicted Nursing
Recruitment Difficulty Score Based on
All North Carolina Facilities Starting
point for having difficulty to recruit
RNs (> -3)

[D]
Table
16. Coefficient Estimates of the Ordered
Probit Nursing Shortage Model Based on
All Facilities in North Carolina
Variable |
Hospital |
Home
Health |
Long-Term
Care |
Public
Health |
| Coeff |
p |
Coeff |
p |
Coeff |
p |
Coeff |
p |
| Demographic
Variables |
| Dummy
for metropolitan area |
-0.343 |
0.323 |
|
|
-0.750 |
0.016 |
-0.474 |
0.289 |
| Proportion
of population < 5 years |
|
|
|
|
-7.032 |
0.009 |
|
|
| Proportion
of population age 20 - 65 years |
|
|
25.836 |
0.001 |
|
|
|
|
| Proportion
of population >65 years |
|
|
8.543 |
0.145 |
-20.231 |
0.001 |
27.654 |
0.001 |
| Proportion
of White population |
|
|
|
|
|
|
-59.011 |
0.005 |
| Proportion
of Black population |
|
|
2.270 |
0.121 |
|
|
-50.752 |
0.014 |
| Proportion
of Hispanic population |
|
|
1.207 |
0.039 |
-1.844 |
0.000 |
-4.511 |
0.033 |
| Proportion
of AIAN population |
1.202 |
0.150 |
|
|
0.586 |
0.020 |
|
|
| Income
per capita ($10,000) |
0.692 |
0.099 |
|
|
-0.593 |
0.296 |
-2.144 |
0.066 |
| Percentage
of population in poverty |
|
|
-0.232 |
0.004 |
-0.110 |
0.099 |
-0.262 |
0.014 |
| Proportion
of population using Medicare |
|
|
|
|
1.5818 |
0.040 |
|
|
| Proportion
of population using Medicaid |
|
|
|
|
|
|
2.177 |
0.052 |
| Nursing
Variables |
| #
of RNs per 100 individuals |
|
|
|
|
-1.103 |
0.009 |
|
|
| #
of Med Records & Health Info Techs
per 1,000 individuals |
|
|
|
|
1.942 |
0.008 |
|
|
| #
of hospitals per 10,000 individuals |
|
|
2.242 |
0.039 |
|
|
-4.656 |
0.000 |
| #
of Hospices per 10,000 individuals |
-1.035 |
0.454 |
0.696 |
0.450 |
|
|
2.457 |
0.048 |
| Dummy
for county having hospital with nursing
school |
-1.210 |
0.061 |
|
|
0.399 |
0.427 |
2.457 |
0.048 |
| #
of hospital full time personals per
10 individuals |
1.176 |
0.469 |
|
|
-2.89 |
0.101 |
|
|
| #
of nursing home full time personals
per 1,000 individuals |
|
|
-0.550 |
0.038 |
|
|
|
|
| Ratio
of average RN salary to median income |
|
|
2.530 |
0.010 |
-1.877 |
0.018 |
-4.023 |
0.004 |
| Facility
Variables |
| Facility
type |
-5.384 |
0.078 |
-22.06 |
<0.0005 |
9.801 |
0.022 |
63.513 |
0.001 |
| Total
number of budgeted RN positions |
-0.130 |
0.092 |
-1.946 |
0.121 |
1.834 |
0.438 |
-2.491 |
0.012 |
| RN
vacancy rate |
1.936 |
0.046 |
50.736 |
<0.0005 |
35.816 |
0.010 |
|
|
| Total
number of budgeted LPN positions |
-0.854 |
0.115 |
|
|
|
|
|
|
| LPN
vacation rate |
|
|
|
|
14.321 |
0.114 |
|
|
| RN
turnover rate |
1.729 |
0.322 |
|
|
0.1987 |
0.291 |
6.396 |
0.005 |
Recruiting Difficulty Thresholds
Very easy (1) to recruit if score < -5.494008
Easy (2) to recruit if score < -4.429288
Not difficult (3) to recruit if score
< -3.348048
Difficult (4) to recruit if score < -2.158602
Very difficult (5) to recruit if score
> -2.158602
McKelvey-Zavoina R2 = 0.71
Table
17. Cross Tabulation of Actual Nursing
Recruitment Difficulty Indicator by Predicted
Nursing Recruitment Difficulty Indicator
| Actual |
Predicted |
|
| 1 |
2 |
3 |
4 |
5 |
Total |
| 1 |
1 |
9 |
7 |
0 |
0 |
17 |
| 2 |
0 |
10 |
32 |
9 |
0 |
51 |
| 3 |
0 |
3 |
66 |
31 |
2 |
102 |
| 4 |
0 |
7 |
40 |
47 |
5 |
99 |
| 5 |
0 |
0 |
9 |
26 |
21 |
56 |
| Total |
1 |
29 |
154 |
113 |
28 |
325 |
Note: Values on the diagonal are shaded
Spearman correlation coefficient = 0.53
Test of H0: Correlation = 0
H0 is rejected with p-value
< 0.0005
The descriptive statistics of predicted
nursing shortage scores by type of facility
are presented in Table 18, which shows
that on average the shortage was highest
for public health and lowest for hospitals.
This means that on average public health
facilities faced the most nursing recruitment
difficulty and hospitals faced the least.
Table
18. Descriptive Statistics of For Predicted
Nursing Recruitment Difficulty Score Based
on Ordered Probit Model Using North Carolina
Data for 2004
| Facility
Type |
Predicted
Shortage Score |
| Mean |
SD |
Minimum |
Maximum |
| Hospital |
-3.668 |
0.466 |
-5.0797 |
-2.4393 |
| Home
health |
-3.391 |
0.901 |
-5.1829 |
0.0163 |
| Long
term care |
-3.342 |
0.848 |
-5.5617 |
0.5345 |
| Public
health |
-2.432 |
3.298 |
-5.1676 |
14.8448 |
Figure 12 shows more clearly the differences
in recruiting difficulty among the four
types of facilities. The figure presents
the distribution of the predicted nursing
recruitment difficulty by type of facility.
From the figure we can see that a relatively
high proportion of public health agencies
have high scores (the right side of the
figure). This confirms the finding presented
above in Table 18.
Figure
12. Predicted Nursing Recruitment Difficulty
Scores, by Facility Type in North Carolina,
2004
 [D]
[D]
Tables 19 to 22 present the coefficient
estimates for hospitals, home health facilities,
long-term care facilities, and public
health, respectively, based on separate
ordered probit models for each type of
facility. Similar to Technique 1, using
these coefficients one can calculate predicted
nursing recruitment difficulty scores
for each facility. The key difference
is that one cannot compare the predicted
nursing shortage scores of different types
of facilities. For example, a score for
a hospital cannot be compared to a score
for a nursing home.
In general, the p-values obtained from
separate models were lower than those
obtained from the simultaneous model (i.e.,
the results were more significant statistically).
This implied that the number of significant
variables obtained from the separate models
was greater than the number of significant
variables obtained from the simultaneous
model. These lower p-values also tell
us that the estimation using separate
models gave more efficient results.
Both techniques provided very similar
patterns of predicted nursing recruitment
difficulty scores for each type of facility.
The strength of the relationship between
predicted nursing shortage scores obtained
from the two models can be measured using
a correlation coefficient. The Spearman
correlation coefficient between the two
predicted scores was 0.9985 for hospitals;
0.9911 for home health agencies; 0.9991
for long-term care facilities; and 0.9853
for public health agencies. This meant
both techniques gave very similar ranks
of predicted nursing recruitment difficulty
scores across facilities in North Carolina.
Table
19. Coefficient Estimates of the Nursing
Recruitment Difficulty Model Based on
Ordered Probit Analysis of North Carolina
Hospital Data, 2004
| Variable |
Coeff. |
p-value |
-0.47 |
0.195 |
1.72 |
0.012 |
0.89 |
0.042 |
1.44 |
0.392 |
-1.24 |
0.383 |
-1.54 |
0.022 |
-0.16 |
0.041 |
2.52 |
0.014 |
-1.13 |
0.047 |
2.28 |
0.209 |
-0.41 |
0.712 |
1.25 |
0.240 |
2.67 |
0.013 |
4.19 |
<0.0005 |
McKelvey-Zavoina R2 = 0.362
Table
20. Coefficient Estimates of the Nursing
Recruitment Difficulty Model Based on
Ordered Probit Analysis of North Carolina
Home Health Agency Data, 2004
| Variable |
Coeff. |
p-value |
6.75 |
0.234 |
22.99 |
0.002 |
1.64 |
0.241 |
0.88 |
0.128 |
-0.18 |
0.022 |
2.58 |
0.016 |
-0.57 |
0.027 |
0.37 |
0.681 |
2.04 |
0.036 |
-1.91 |
0.120 |
48.77 |
<0.0005 |
14.58 |
0.005 |
15.20 |
0.004 |
16.39 |
0.002 |
17.61 |
0.001 |
McKelvey-Zavoina R2 = 0.406
Table
21. Coefficient Estimates of the Nursing
Recruitment Difficulty Model Based on
Ordered Probit Analysis of North Carolina
Long-Term Care Facility Data, 2004
| Variable |
Coeff. |
p-value |
-0.69 |
0.026 |
-6.30 |
0.019 |
-18.39 |
0.001 |
-1.68 |
0.001 |
0.54 |
0.033 |
1.37 |
0.074 |
-0.58 |
0.304 |
-0.10 |
0.149 |
1.68 |
0.020 |
-2.52 |
0.151 |
-0.98 |
0.020 |
-1.78 |
0.024 |
0.38 |
0.449 |
1.98 |
0.406 |
29.88 |
0.032 |
13.01 |
0.148 |
0.18 |
0.332 |
-14.10 |
<0.0005 |
-12.86 |
<0.0005 |
-12.14 |
0.001 |
-11.11 |
0.002 |
McKelvey-Zavoina R2 = 0.364
Table
22. Coefficient Estimates of the Nursing
Recruitment Difficulty Model Based on
Ordered Probit Analysis of North Carolina
Public Health Agency Data, 2004
| Variable |
Coeff. |
p-value |
| Dummy
for metropolitan area |
-0.65 |
0.083 |
| Proportion
of population >65 years |
26.18 |
0.001 |
| Proportion
of White population |
-41.84 |
<0.0005 |
| Proportion
of Black population |
-33.75 |
0.003 |
| Proportion
of Hispanic population |
-3.01 |
0.012 |
| Proportion
of population using Medicaid |
1.82 |
0.029 |
| Income
per capita ($10,000) |
-2.35 |
0.025 |
| Percentage
of population in poverty |
-0.33 |
<0.0005 |
| #
of hospitals per 10,000 individuals |
-4.32 |
<0.0005 |
| #
of hospices per 10,000 individuals |
1.50 |
0.152 |
| Ratio
of average RN salary to median income |
-3.06 |
0.015 |
| Dummy
for county having hospital with professional
nursing school |
-0.40 |
0.666 |
| Total
number of budgeted RN positions |
-1.59 |
0.054 |
| RN
turnover rate |
5.60 |
0.001 |
| Threshold
1 |
-52.36 |
<0.0005 |
| Threshold
2 |
-51.37 |
<0.0005 |
| Threshold
3 |
-50.34 |
<0.0005 |
| Threshold
4 |
-49.21 |
<0.0005 |
McKelvey-Zavoina R2 = 0.830
One of the objectives of this study was
to assess the importance of facility-specific
variables for predicting the difficulty
of recruiting RNs and other measures of
nursing shortages. Figures 13 through
16 present the results of a series of
four comparisons of models, one for each
of the four facility types. The figures
revealed, based on OLS analysis of data
from North Carolina in 2004, that predictions
of nurse recruiting difficulty with and
without facility data were positively
and significantly correlated for all four
types of facilities. Similar results were
obtained using ordered probit models based
on the same data. This result was encouraging
for subsequent studies of nursing shortages
and related topics because it suggested
that, although some predictive accuracy
was lost when facility data were not available,
at least some helpful insights could be
obtained from community data alone.
Figure
13. Comparison of OLS Nursing Recruitment
Difficulty Models for Hospitals in North
Carolina, With and Without Facility Variables,
2004
 [D] [D]
Figure
14. Comparison of OLS Nursing Recruitment
Difficulty Models for Home Health Agencies
in North Carolina, With and Without Facility
Variables, 2004
 [D]
[D]
Figure
15. Comparison of OLS Nursing Recruitment
Difficulty Models for LTC Agencies in
North Carolina, With and Without Facility
Variables, 2004
 [D]
[D]
Figure
16. Comparison of OLS Nursing Recruitment
Difficulty Models for Public Health Agencies
in North Carolina, With and Without Facility
Variables, 2004
 [D]
[D]
As part of the process of developing
and refining the North Carolina ordered
probit models, a special validation process
was devised to confirm that the values
of the nursing recruitment difficulty
index predicted by the statistical models
were realistic. This process was made
more difficult by the requirement of anonymity
of the facilities by the NCCN.
The validation procedure used involved
sending the anonymous facility ID Codes
back to the NCCN for the 10 facilities
of each type that had the highest and
lowest nursing recruitment difficulty
index scores. NCCN staff then attached
to each ID Code the name and contact information
for each facility on the list. These individuals
were then surveyed over the telephone
(see Appendix C) asking for insights about
the difficulty experienced by the facility
in recruiting RNs at the time, six months
earlier, and in 2004 (when the original
survey data were collected).
When the survey responses were returned,
the data were entered into a separate
file for analysis. The primary analysis
used in this validation was based on a
Spearman Rank-Order Correlation coefficient
between the variable indicating that the
facility was in the top 10 or bottom 10
for its type, and the 5-point scale from
the questionnaire rating difficulty of
recruiting RNs in 2004. Based on the 48
(out of a possible 80) facilities that
responded to the survey questionnaire,
the Spearman’s Rho was 0.347, p = 0.016.
Although the correlation between the original
rating of recruiting difficulty and the
retrospective rating obtained in the validation
process was statistically significant,
the low value of the correlation coefficient
gave little support for the use of these
kinds of subjective measures in a formal
shortage designation process.
Although this statistical test (that
the correlation coefficient = zero) was
not particularly stringent, it did provide
an indication that the independent variables
in the ordered probit model helped to
explain variations in nursing recruitment
difficulty. Based on this conclusion,
project staff moved forward with plans
to examine the possibility of using a
model estimated in one state to predict
nursing recruitment difficulty in another
state (in this case, North Dakota).
Data were shared with project staff by
two states (North Carolina and North Dakota).
Although the North Dakota (ND) data were
based on a survey instrument identical
in many respects with the North Carolina
(NC) questionnaire, the ND survey did
not ask the same question about difficulty
recruiting RNs that was asked in NC. ND
did ask a question about vacancy rates
for RNs in the facilities, but unfortunately,
the question was answered by only 20%
of the respondents. The net result was
that the ND data did not provide a sound
dependent variable to use in an independent
modeling effort similar to that conducted
for the NC data.
K. Models
for North Carolina and North Dakota Combined
The characteristics of counties in North
Carolina and counties in North Dakota
differ considerably. For example, using
the ARF database, 40% of counties in North
Carolina were metropolitan compared to
only 8% of counties in North Dakota; 83%
of counties in North Carolina had a hospital
compared to 64% of counties in North Dakota.
In addition, 63% of counties in North
Carolina had a hospice compared to 25%
of counties in North Dakota.
The averages of community variables of
counties in North Carolina and in North
Dakota are presented in Table 23. The
average percentage of Whites in the population
was higher in North Dakota than in North
Carolina. The average per capita number
of hospital beds in North Dakota was more
than three times higher than in North
Carolina. Although the average per capita
number of hospital beds was much higher
in North Dakota than in North Carolina,
the average per capita number of full
time RNs was slightly lower in North Dakota
. Moreover, the average percentage of
the population in poverty in North Carolina
was slightly higher than that of North
Dakota, while average per capita income
was slightly higher in North Carolina.
Table
23. Means of Community Variables for NC
and ND
| Variable |
State |
| NC |
ND |
| Dummy
for metropolitan area |
0.400 |
0.076 |
| Income
per capita |
$23,520 |
$22,820 |
| Proportion
of White population |
0.715 |
0.920 |
| Proportion
of AIAN population |
0.016 |
0.061 |
| Proportion
of Black population |
0.216 |
0.003 |
| Proportion
of Hispanic population |
0.038 |
0.008 |
| #
Hospital beds per 100 individuals |
0.295 |
0.718 |
| #
Hospices per 10,000 individuals |
0.147 |
0.276 |
| Hospital
full time personals per 10 individuals |
0.082 |
0.068 |
| Total
Medicaid inpatient days per population |
0.193 |
0.473 |
| Total
Medicare inpatient days per population |
0.270 |
0.429 |
| #
Med Records & Health Info Techs
per 1,000 individuals |
0.158 |
0.030 |
| Nursing
home full time personals per 1,000
individuals |
0.310 |
1.001 |
| Proportion
of population < 5 years |
0.061 |
0.055 |
| Proportion
of population >65 years |
0.141 |
0.201 |
| Proportion
of population age 20 - 65 years |
0.579 |
0.541 |
| Percentage
of population in poverty |
13.7% |
12.2% |
| #
Full time RNs per 100 individuals |
0.247 |
0.227 |
The differences between North Carolina
and North Dakota were not only in terms
of the community characteristics, but
also in terms of facility characteristics.
For example, 76% of facilities in North
Dakota reported zero vacancy rates compared
to 37% in North Carolina; 53% of facilities
in North Dakota reported zero turnover
rates compared to 13% in North Carolina.
Table 24 presents the averages of facility
variables in North Carolina and North
Dakota and shows that characteristics
of the states’ facilities differ considerably.
The average number of budgeted RN positions
of facilities in North Carolina is almost
four times the average in North Dakota.
In addition, the average RN vacancy rate
of facilities in North Carolina is almost
three times the average in North Dakota.
Table
24. Means of Facility Variables for NC
and ND
| Variable |
State |
| NC |
ND |
| Number
of budgeted RN positions |
79.28 |
20.59 |
| Number
of budgeted LPN positions |
9.94 |
6.14 |
| RN
vacancy rate |
9.51 |
3.64 |
| RN
turnover rate |
29.02 |
12.29 |
| LPN
vacancy rate |
7.41 |
2.46 |
| LPN
turnover rate |
28.23 |
6.01 |
Using data from both North Carolina and
North Dakota together, OLS regression
was run for RN vacancy rates on a combination
of community variables and facility variables.
Vacancy rate was chosen because it was
the dependent variable collected using
the same definitions in both states. A
state dummy variable was included, defined
as 1 if a facility was located in North
Dakota and 0 if it was located in North
Carolina. The model was estimated separately
for each type of facility. The coefficient
estimates are presented in Tables 25 to
28 for hospitals, home health agencies,
long-term care facilities, and public
health agencies, respectively. Variables
included in the model were selected based
on their p-values. Variables with smaller
p-values can explain variation in dependent
variable better than variables with higher
p-values. In addition, adjusted-R2
was also considered when selecting variables
to be included in the model. The higher
the adjusted-R2, the better
the model.
The table shows that each type of facility
yielded different sets of independent
variables that were statistically significant.
For example, dummy for North Dakota was
not significant in both hospital
and long-term care models, while it was
significant in both home health and public
health models.
The dependent variable in the models
was RN vacancy rate. The higher the value
of RN vacancy rate the bigger was the
shortage. Thus, a positive coefficient
revealed that a facility with a higher
value of the corresponding independent
variable faced a bigger shortage compared
to a facility with a lower value of the
variable. A negative coefficient revealed
that a facility with a higher value of
the corresponding independent variable
faced less shortage compared to a facility
with a lower value. For example, the coefficient
estimate of dummy for North Dakota in
the home health model was negative. This
indicated that on average home health
facilities in North Dakota faced less
shortage than home health facilities in
North Carolina.
Table
25. OLS Coefficient Estimates for Hospital
Setting for Combined NC & ND Model
(Dependent variable is RN Vacancy Rate)
| Independent
Variable |
Estimate |
Std
Err |
t-stat |
p-value |
| Intercept |
-0.7335 |
0.3863 |
-1.899 |
0.061 |
| Dummy
for North Dakota |
0.0155 |
0.0203 |
0.7619 |
0.448 |
| Dummy
for metropolitan area |
0.0239 |
0.0194 |
1.2323 |
0.222 |
|
Income per capita ($10,000) |
0.0327 |
0.0270 |
1.2096 |
0.230 |
| Proportion
of Hispanic population *10 |
-0.0226 |
0.0358 |
-0.629 |
0.531 |
| Total
Medicare inpatient days per population |
-0.0728 |
0.0173 |
-4.219 |
0.0001 |
| Proportion
of population < 5 years *10 |
0.2115 |
0.1239 |
1.7076 |
0.092 |
| Proportion
of population >65 years |
0.8423 |
0.3865 |
2.1792 |
0.032 |
| Proportion
of population age 20 - 65 years |
0.5597 |
0.4809 |
1.1639 |
0.248 |
| #
Full time RNs per 100 individuals |
0.0828 |
0.0392 |
2.1113 |
0.038 |
| Ratio
of average RN salary to median income |
0.0739 |
0.0440 |
1.6775 |
0.098 |
| Number
of budgeted RN positions |
-0.0021 |
0.0021 |
-1.008 |
0.317 |
| RN
turnover rate |
0.2252 |
0.0655 |
3.4395 |
0.001 |
| LPN
vacancy rate |
0.1661 |
0.0523 |
3.1785 |
0.002 |
| LPN
turnover rate |
0.0048 |
0.0159 |
0.3003 |
0.765 |
R2 = 0.400
Table
26. Coefficient Estimates for Home Health
Setting for Combined NC & ND Model
(Dependent variable is RN Vacancy Rate)
| Independent
Variable |
Estimate |
Std
Err |
t-stat |
p-value |
| Intercept |
-0.5407 |
0.2488 |
-2.174 |
0.032 |
| Dummy
for North Dakota |
-0.0811 |
0.0450 |
-1.801 |
0.075 |
| Dummy
for county w/ hospital w/ professional
nursing school |
0.0945 |
0.0699 |
1.3522 |
0.180 |
| Income
per capita ($10,000) |
0.0789 |
0.0329 |
2.3969 |
0.018 |
| Proportion
of Hispanic population *10 |
-0.0966 |
0.0606 |
-1.593 |
0.114 |
| #
Hospitals per 10,000 individuals |
-0.0240 |
0.0217 |
-1.105 |
0.272 |
| #
Med records and health info techs
per 1,000 individuals |
0.0607 |
0.0579 |
1.0491 |
0.297 |
| Proportion
of population < 5 years *10 |
0.4565 |
0.2532 |
1.8031 |
0.074 |
| Proportion
of population >65 years |
1.1646 |
0.5227 |
2.2279 |
0.028 |
| Number
of budgeted RN positions |
-0.2623 |
0.1473 |
-1.781 |
0.078 |
| RN
turnover rate |
0.1234 |
0.0360 |
3.4259 |
0.001 |
| LPN
vacancy rate |
0.1937 |
0.0687 |
2.8196 |
0.006 |
| Number
of budgeted LPN positions |
0.6455 |
0.5568 |
1.1593 |
0.249 |
R2 = 0.346
Table
27. Coefficient Estimates for Long-Term
Care Setting for Combined NC & ND
Model (Dependent variable is RN Vacancy
Rate)
| Independent
Variable |
Estimate |
Std
Err |
t-stat |
p-value |
| Intercept |
0.2447 |
0.2397 |
1.0207 |
0.3090 |
| Dummy
for North Dakota |
0.0392 |
0.0337 |
1.1655 |
0.2457 |
| Income
per capita ($10,000) |
-0.0324 |
0.0380 |
-0.8517 |
0.3957 |
| Proportion
of Hispanic population *10 |
0.0567 |
0.0443 |
1.2798 |
0.2026 |
| Proportion
of population < 5 years *10 |
-0.2825 |
0.1789 |
-1.5792 |
0.1164 |
| Proportion
of population >65 years |
-0.5939 |
0.3957 |
-1.5007 |
0.1355 |
| #
Full time RNs per 100 individuals |
0.0343 |
0.0459 |
0.7470 |
0.4562 |
| Ratio
of average RN salary to median income |
0.0389 |
0.0569 |
0.6834 |
0.4954 |
| Number
of budgeted RN positions |
-0.1725 |
0.1351 |
-1.2765 |
0.2037 |
| RN
turnover rate |
0.0223 |
0.0199 |
1.1191 |
0.2648 |
| LPN
vacancy rate |
0.3508 |
0.0754 |
4.6521 |
0.0000 |
| Number
of budgeted LPN positions |
0.4843 |
0.1735 |
2.7920 |
0.0059 |
R2 = 0.238
Table
28. Coefficient Estimates for Public Health
Setting for Combined NC & ND Model
(Dependent variable is RN Vacancy Rate)
| Independent
Variable |
Estimate |
Std Err |
t-stat |
p-value |
| Intercept |
0.0755 |
0.1079 |
0.6999 |
0.4859 |
|
Dummy for North Dakota |
-0.0848 |
0.0288 |
-2.9455 |
0.0042 |
| Dummy
for County w/ Hospital w/ Prof Nursing
School |
0.0622 |
0.0708 |
0.8792 |
0.3818 |
| Proportion
of AIAN population *10 |
0.0652 |
0.0226 |
2.8856 |
0.0050 |
| Proportion
of Black population |
0.1231 |
0.0937 |
1.3133 |
0.1927 |
| #
Hospitals per 10,000 individuals |
0.0466 |
0.0239 |
1.9535 |
0.0541 |
| #
Hospices per 10,000 individuals |
-0.0541 |
0.0293 |
-1.8447 |
0.0686 |
| Total
Medicaid inpatient days per population |
-0.0910 |
0.0378 |
-2.4066 |
0.0183 |
| Proportion
of population < 5 years *10 |
-0.2130 |
0.1284 |
-1.6591 |
0.1008 |
| Percentage
of population in poverty |
-0.0081 |
0.0041 |
-1.9653 |
0.0527 |
| Ratio
of average RN salary to median income |
0.1357 |
0.0428 |
3.1690 |
0.0021 |
| RN
turnover rate |
0.0710 |
0.0421 |
1.6854 |
0.0956 |
R2 = 0.389 |