|
|
 |
|
|
In 2000, the New Mexico population was 1.82
million and had been estimated to increase by
3 percent to 1.87 million in 20032.
The racial/ethnic population of New Mexico in
2003 consisted of 45 percent Non-Hispanic Whites,
42 percent Hispanics/Latinos(as), 2 percent
Blacks/African-Americans, 9 percent American
Indians/Alaskan Natives, and 3 percent Other
Races. With rates of 80 births per 1,000 women
of childbearing ages, Hispanics/Latinos(as)
were a fast-growing race/ethnic group in New
Mexico, followed by Blacks/African-Americans
(69 per 1,000) and Non-Hispanic Whites (58 per
1,000)3.
The American Indian/Alaskan Native rate was
86 births per 1,000 women of childbearing age.
The population of New Mexico made up 2.9 percent
of the 65 million people who lived in the four
States (Arizona, California, New Mexico, and
Texas) that share a Border with Mexico. While
California contributed 55 percent of the population
of the four States, Texas and Arizona accounted
for 34 percent and 9 percent, respectively.
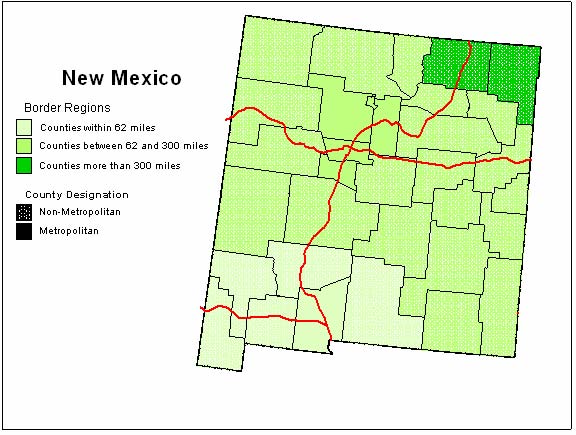
This report provides information about three
regions of New Mexico based on proximity to
the U.S.-Mexico Border as defined by the USMBHC.
New Mexico has 33 counties, 6 of which are within
62 miles (100 kilometers) of the U.S.-Mexico
Border. These are identified as Border
Counties in this report. There are 25 counties
between 62 and 300 miles of the U.S.-Mexico
Border. Finally, there are two counties more
than 300 miles from the U.S.-Mexico Border.
Population Dynamics
Geographic Distribution
Ninety-nine percent of New Mexico’s population
lived in counties within 300 miles of the
U.S.-Mexico Border in 2000 (Table 1). Counties
within 62 miles of the Border contained
17 percent and counties between 62 and 300
miles of the Border contained 82 percent
of the State population. Counties more than
300 miles from the Border were home to
only 1 percent of the State’s population.
Fifty-six percent of the population in the counties
within 62 miles of the Border lived
in Dona Ana County where Las Cruces, New Mexico,
is located. The fact that 5 of the counties
within 62 miles of the Border in New Mexico
were non-metropolitan indicates that much of
the region was sparsely populated rural county.4
Race/Ethnicity
Table 2 shows that in 2003, an estimated 318,450
New Mexico residents lived in the Border Counties,
of whom 54 percent were Hispanic/Latino(a),
a proportion somewhat higher than the New Mexico
State population (42 percent Hispanic/Latino(a)).
Of the 6.9 million people who lived in the Border
Counties in the 4 Border States, 49 percent
were Hispanic/Latino(a).5
Education
Level of education completed is a major concern
in the New Mexico Border Counties as 15 percent
of residents had completed fewer than 9 years
of education in 2000. In comparison, 9.3 percent
of the New Mexico population and 7.5 percent
of the U.S. population had similarly low levels
of education (Table 6).

Source: U.S. Census Bureau (2000).
Income6
The Border Counties in New Mexico were different
from California and Arizona in the nature of
the populations included in Border Counties,
but similar to Texas. In New Mexico’s
Metropolitan Statistical Area (MSA) of Las Cruces,
the median family income in 2000 was $33,576.
In Texas, similar incomes were reported in the
following MSAs in 2000: El Paso: $33,410; Laredo:
$29,394; and, Brownsville – Harlingen:
$27,853. In comparison, the New Mexico median
family income in 2000 is much lower than the
median family incomes in the MSAs of San Diego,
California, at $53,438; in Phoenix-Mesa, Arizona,
at $51,126; and in Tucson, Arizona, at $44,446.
The Texas MSAs included as Border Counties according
to the definition used by the Texas Comptroller
of Public Accounts, but not directly on the
U.S.-Mexico Border (San Antonio and Corpus Christi),
had median family incomes similar to those of
Arizona and California. Hispanic/Latino(a) median
family incomes ranged from $24,500 to $28,500
in New Mexico and Texas Border MSAs, respectively,
compared to higher family medians of $31,000
to $34,000 in Arizona and California Border
MSAs.
Poverty
Table 4 shows that New Mexico is a poor State
with 31 percent of families reported as living
below 150 percent of the Federal poverty guidelines
in 2000. Thirty-nine percent of those living
within 62 miles of the Border fall
within this category compared to 25 percent
of families living in Border States, and 21
percent of U.S. families. The U.S. Federal Poverty7
Thresholds were established as a baseline to
develop guidelines for determining eligibility
for Federal and State programs such as Medicaid.
In 2000, $17,761 for a family of four was established
as the poverty threshold.
Source: U.S. Census Bureau (2000).
Health Access
It is surprising that with such a high number
of people living on poverty wages that only
24 percent of respondents to the Behavioral
Risk Factor Surveillance System (BRFSS) in counties
within 62 miles of the Border indicated
that, at the current time, they were not covered
by health insurance.8,9
Across New Mexico, 21 percent of the population
indicated they were not covered by health insurance
compared to 15 percent of the U.S. population
(Table 5).
Health Professional Shortage Areas (HPSAs) were
the method that HRSA used to identify areas
of a State that did not have a sufficient supply
of health professionals to meet the health needs
of the population. In New Mexico, 8.1 percent
of the population within 62 miles of the Border
resided in a primary care HPSA, either single
or partial county (Table 55). While 44 percent
of the population within 62 miles of the Border
lived in a dental HPSA (Table 56), 100 percent
of residents lived in a mental HPSA (Table 57).
Statewide, 36 percent of the population lived
in a primary care, 43 percent lived in a dental,
and 61 percent lived in a mental HPSA.
Health status indicators for this Report were
based on the Healthy Border 2010 Goals and Objectives
established by the U.S.-Mexico Border Health
Commission in 2003. The Commission is a binational
organization dedicated to addressing the pervasive
health needs of the U.S.-Mexico Border.
| The overarching goals of the Healthy Border
Program are: |
- Improve the quality and increase
the years of healthy life, and
- Eliminate health disparities
|
| The twenty Healthy Border (HB) 2010 objectives
fall into eleven principal areas with their
specific objectives as follows: |
- Improve access to primary health
care
- Reduce cancer mortality in women
through improved screening for breast
and cervical cancers
- Reduce morbidity and mortality from
diabetes mellitus
- Improve water quality through improved
sanitation and reduce amount of acute
pesticide poisoning
- Reduce transmission of HIV
- Improve rates of immunization and
reduce rates of infectious diseases
- Reduce mortality from unintentional
injuries
- Reduce infant mortality and increase
the number of women receiving prenatal
care
- Reduce the suicide mortality rate
by improving mental health
- Increase the usage of dental and
oral health services
- Reduce morbidity from asthma
|
The tables in this report provide detailed
information about health status in New Mexico.
Comparisons to the Healthy Border objectives
are used to highlight disparities in health
with a focus on the Border Counties (those within
62 miles of the U.S.-Mexico Border).
Breast
and Cervical Cancer
| Healthy
Border 2010 Objectives for breast
and cervical cancer:
- To
reduce the female breast cancer
death rate to 33.7 deaths per
100,000 women ages 25 or more
- To
reduce the cervical cancer death
rate to 4.0 deaths per 100,000
women ages 25 or more
|
- Screening for breast cancer is an
important aspect of women’s health.
Evidence from the BRFSS in 2002 show
that 79 percent of women living in New
Mexico Border Counties had a mammogram
within the past 2 years; this is
similar to the proportion of women living
in New Mexico (80 percent) and the Border
States (83 percent) who have had a mammogram
within the past 2 years.10
- The breast cancer incidence rate
in the Border Counties was 111 per 100,000
females; this was slightly lower than
the New Mexico incidence rate of 120
per 100,000 (Table 7).
- The age-adjusted11
breast cancer mortality rate in
the New Mexico counties within 62
miles of the U.S.-Mexico Border
in 2002 was 12.4 deaths per 100,000
population; this was slightly higher
than the New Mexico rate of 12.1 per
100,000 and the Border States rate of
13.3 (Table 7). When the rate is calculated
only for women, the rate was 22.6 deaths
in the New Mexico Border Counties. This
rate was similar to the New Mexico and
Border States rates of 21.9 and 23.9
deaths per 100,000 females, respectively.
The loss due to premature breast cancer
death cost 69 years of life per 100,000
population in New Mexico in 2002 (Table
7). The years of potential life lost
(YPLL) rate was consistent across New
Mexico but was somewhat higher in the
Border Counties (78 years). This was
higher than the rate in the Border States
(72 years per 100,000 females), but
somewhat lower than the U.S. rate of
86 years per 100,000 population. The
number of years of life lost to breast
cancer is brought more into focus when
the rate is calculated for those most
effected by breast cancer: 138 years
of life were lost per 100,000 females
in 2002 in New Mexico. The YPLL rate
for females in New Mexico counties within
62 miles of the Border was 154
per 100,000.
- Regular screening with pap smears
helps with early detection of cervical
cancer. Seventy-nine percent of women
living in New Mexico Border Counties
had received a pap smear within the
past 2 years; this rate was the same
as New Mexico (79 percent) and similar
to women living in the Border States
(82 percent) in general.12
- In the New Mexico Border Counties,
the cervical cancer incidence rate
was 10.3 per 100,000 females; this was
slightly higher than the New Mexico
incidence rate of 9.3 per 100,000 females
(Table 7).
- In New Mexico, the age-adjusted
cervical cancer mortality rate
at 1.9 per 100,000 females was lower
than the Border States rate of 2.6 and
the U.S. rate of 2.7 deaths per 100,000
females (Table 7). The YPLL rate of
20 in New Mexico was also lower than
the Border States and the U.S. rates
of 32 and 34 years of life lost per
100,000 females, respectively.
Diabetes
Mellitus
| Healthy
Border 2010 Objectives for diabetes
mellitus:
- Reduce
the hospital discharge rate to
11.2 per 10,000 population for
diabetes mellitus
- Reduce
the diabetes death rate to 24.2
deaths per 100,000 population
|
In 2002, diabetes was the sixth leading
cause of death in the United States13
and New Mexico.14
Recent studies show that Type 2 diabetes
is preventable.15
Overweight and obesity contribute to diabetes
prevalence.16
Findings from the BRFSS indicate that
Hispanics/Latinos(as) have a higher prevalence
of diabetes than Non-Hispanic Whites at
comparable Body Mass Index (BMI) ranking.17
Table 8 provides information about diabetes
in New Mexico.
Sources: Hospital Inpatient Discharge Data,
New Mexico Health Policy Commission (2002),
and Office of New Mexico Vital Records and
Health Statistics, Public Health Division,
New Mexico Department of Health (2002).
- Fifty-six percent of New Mexico residents
were overweight or obese based on Body
Mass Index: 37 percent were overweight
but not obese, while 19.7 percent were
obese. There was little variation across
geographic areas of the State with respect
to this measure (Table 9).
- The reported prevalence of diabetes
in New Mexico’s Border Counties
was 6.8 percent of adults responding
to the BRFSS; this was slightly higher
than the State rate of 6.3 percent and
slightly below the Border States rate
of 7.3 percent.
- Residents of the counties within
62 miles of the Border were slightly
less likely to be hospitalized for
diabetes related issues (9.8 hospital
discharges per 100,000 population) than
New Mexico residents in general (11.6
per 100,000 population). This was lower
than the Border States rate of 14.5
per 100,000 and notably lower than the
U.S. rate of 20 hospital discharges
per 100,000 population (Table 8).
- The diabetes age-adjusted mortality
rate was 36 per 100,000 population
in the New Mexico Border Counties; this
was somewhat higher than the New Mexico
rate of 33 deaths per 100,000 population
which was higher than both the Border
States and U.S. rates at 26 and 25 deaths
per 100,000 population, respectively.
- Premature death due to diabetes
resulted in 91 years of potential life
lost per 100,000 population in the counties
within 62 miles of the Border, and 89
years of potential life lost per 100,000
across all of New Mexico (Table 8).
This suggests that many of the people
in New Mexico who die as a result of
diabetes or diabetes complications die
at a younger age than those in other
Border States. New Mexico diabetes years
of potential life lost rates were higher
than the Border States (73 years lost
per 100,000 population) and the U.S.
(79 years lost per 100,000 population)
rates.
Although hospital discharge rates were
below the HB 2010 goal, the mortality
rate for diabetes in the New Mexico Border
Counties was considerably higher than
the goal.
HIV/AIDS
| Healthy
Border 2010 Objective for HIV:
- Reduce
the incidence rate to 4.2 per
100,000 population for HIV
|
HIV/AIDS, despite recent advances in
treatment, is an increasing concern in
Mexico and a major cause of illness and
death in the United States.18
While the latest therapies have reduced
death rates from AIDS in the Border region,
their costs are prohibitive for some segments
of the population.18
Estimates in the United States of the
lifetime costs associated with health
care for HIV/AIDS have increased from
$55,000 to $155,000 or more, contributing
to the burden of illness, disability,
and death.18
In this context, HIV prevention becomes
even more cost-effective.
- The incidence rate for HIV in the
Border Counties was 5.7 cases per 100,000
population in 2002, while the AIDS incidence
rate was 5.0 cases per 100,000 population.
Both rates were lower than the New Mexico
HIV and AIDS incidence rates (5.7 per
100,000 each) and lower than the Border
States rates (15.5 and 11.5 cases per
100,000 respectively, Table 11).
- The HIV incidence rate in the counties
within 62 miles of the Border (at 5.7
per 100,000) was higher than the established
HB 2010 objective.
Hepatitis
and Tuberculosis
| Healthy
Border 2010 Objectives for hepatitis
and tuberculosis:
- Reduce
the incidence rate to 5.5 per
100,000 population for hepatitis
A
- Reduce
the incidence rate to 3.2 per
100,000 population for hepatitis
B
- Reduce
the incidence rate to 5.0 per
100,000 population for tuberculosis
(TB)
|
The TB incidence rate of 5.1 cases per
100,000 population in New Mexico Counties
within 62 miles of the Border
was higher than the State rate of 3.1.
Both rates were much lower than the Border
States rate of 7.8 cases per 100,000 population
(Table 12).
Sources: Hepatitis Program, Public Health
Division, New Mexico Department of Health
(2002), and Tuberculosis Program, Infectious
Disease Bureau, New Mexico Department
of Health (2002).
The New Mexico Border Counties meet
the HB 2010 objectives for hepatitis A
and B, as well as tuberculosis.
Immunization
Coverage
| Healthy
Border 2010 Objectives for immunizations
is to achieve and maintain an immunization
coverage rate of 90% for children
19 to 35 months of age for the following
vaccination series:
- 4+
doses of diphtheria, tetanus,
and pertussis or diphtheria and
tetanus (DTP)
- 3+
doses of haemophilus influenzae
(Hib)
- 3+
doses of hepatitis B vaccine (HepB)
-
3+ does of polio vaccine
- 1
dose of varicella vaccine
-
1 dose of measles, mumps, German
measles vaccine (MCV)
|
If children are properly immunized, most
childhood diseases could be prevented.
This could result in a significant reduction
in the cost of health care. The only reliable
data about childhood immunization status
come from the National Immunization Survey
(NIS). These data were available only
for the Nation and individual States.
- The NIS results estimated that 71
percent (plus or minus 7.2 percent)19
of New Mexico children 19 to 35 months
of age had coverage for the prescribed
vaccination series. Nationally, the
NIS estimated that 73 percent of children
in this age group (plus or minus 1.0)
had received this coverage.
- Hispanic/Latino(a) children had slightly
higher rates of coverage for the prescribed
vaccination series (72 percent, plus
or minus 9.5) than the State total (71
percent, plus or minus 7.2 percent).
Data for other race/ethnic groups were
not available (Table 13).
Injury-Related
Deaths
| Healthy
Border 2010 Objectives for selected
injury related deaths:
- Reduce
the mortality rate to 10.0 per
100,000 population for deaths
due to motor vehicle crashes
- Reduce
the mortality rate to 10.3 per
100,000 population for deaths
due to unintentional injuries
for children ages 0 to 4
|
Injury is identified as the leading
health threat in the first 4 decades of
life.20
Unintentional injury was the third leading
cause of death among all persons in New
Mexico21
and the fifth leading cause in the Border
States and the United States22
in 2002. Most injuries are preventable.
Intentional injury is also among the leading
causes of death with suicide being eighth
and homicide twelfth in New Mexico.21
In the United States, suicide and homicide
rank as the eleventh and fourteenth leading
causes of death.22
Injuries sustained by violent-intentional
or accidental-unintentional means are
responsible for more than 146,000 deaths
each year nationwide.23
Source: Office of New Mexico Vital records
and Health Statistics, Public Health Division,
New Mexico Department of Health (2002).
· The motor vehicle crash
age-adjusted mortality rate in the
Border Counties was 11.4 deaths per 100,000
population; this was noticeably lower
than the New Mexico rate of 16.2 (Table
14). In New Mexico, there were 539 years
of life lost in 2002 for every 100,000
people living in the State. In the counties
within 62 miles of the U.S.-Mexico
Border, the years of potential life
lost rate was 365 per 100,000 population.
There were 103 more years of potential
life lost in New Mexico that in the Border
States (436 years of life lost per 100,000)
in general.
· Statewide, in 2002, unintentional
injuries resulted in 14 deaths to children
ages 0 to 4 in New Mexico.24
Hispanic/Latino(a) children accounted
for 64 percent of these deaths (9 of 14)
statewide.
The motor vehicle crash mortality rate
in counties within 62 miles of the
U.S.-Mexico Border was approaching
the HB objective for 2010.
Prenatal
Care
| Healthy
Border 2010 Objective for prenatal
care:
- Increase
the percent of women starting
prenatal care in the first trimester
to 85 percent
|
Early prenatal care is important to a
healthy pregnancy and is critical in identifying
potential problems that may put the pregnancy
at risk. Risk factors and maternal health
conditions including pregnancy-related
hypertension, gestational diabetes, and
cigarette smoking, among others, which
can contribute to poor infant outcomes
can be identified by screenings as a part
of prenatal care.25
Source: Office of New Mexico Vital Records
and Health Statistics, Public Health Division,
New Mexico Department of Health (2002).
- In New Mexico, only 66 percent of
women received prenatal care in
the first trimester. The proportion
of women receiving prenatal care varied
only slightly by geographic area except
in the two counties more than 300
miles from the Border where 82
percent of mothers received early prenatal
care. There was a large gap between
the proportion of New Mexico mothers
beginning prenatal care in the first
trimester (66 percent) and mothers in
the Border States (82 percent, Table
16).
- In 2002, 74 percent of New Mexico’s
Non-Hispanic White mothers began prenatal
care in the first trimester. Sixty-three
percent of Hispanic/Latina mothers began
prenatal care in the first trimester.
Only 57 percent of American Indian/Alaskan
Native mothers started prenatal care
early in pregnancy.
- All race/ethnic groups in New Mexico
fell below the desired goal set out
in the HB 2010 Objective for the proportion
of women who should start prenatal care
in their first trimester of pregnancy.
Prenatal Care – Border
Teenage Mothers by Race/Ethnicity
Teenage mothers living in the counties
within 62 miles of the Border
fell well below the desired goal established
in the Healthy Border 2010 Objectives
of 85 percent of mothers beginning prenatal
care in the first trimester of pregnancy
(Table 18). In 2002, the proportion of
teenage mothers receiving prenatal care
in New Mexico during the first trimester
was:
- 51 percent of Non-Hispanic White
mothers
- 53 percent of Hispanic/Latina mothers
- 52 percent of Black/African-American
mothers
Prenatal Care – New Mexico
State Teenage Mothers by Geographic Distribution
In New Mexico, the proportion of mothers,
ages 15 to 17, who received prenatal care
in the first trimester varied by geographic
region: 55 percent of mothers in Border
Counties, 50 percent of teenage mothers
in counties between 62 and 300 miles
from the Border, and 63 percent of
mothers in counties more than 300
miles from the Border (Table 18).
Prenatal Care of Border Teenage
Mothers – Comparison of Race/Ethnicity
to State
Teenage mothers of all race/ethnic groups
were substantially below the goals established
by the HB 2010 objectives for beginning
prenatal care in first trimester of pregnancy.
There was little difference by geographic
area within the State (Table 18).
Source: Office of New Mexico Vital Records
and Health Statistics, Public Health Division,
New Mexico Department of Health (2002).
Teenage
Pregnancy
| Healthy
Border 2010 Objective for teenage
pregnancy, ages 15 to 17:
- Reduce
teenage pregnancies to 28.0 per
1,000 women ages 15 to 17
|
- The birth rate for teenage women
in the New Mexico Border Counties within
62 miles of the Border was the
highest in the State at 44 births per
1,000 females between 15 and 17. Statewide,
there were 37 births for each 1,000
females ages 15 to 17 in 2002 (Table
17). This was higher than the overall
Border States teenage birth rate of
29 births per 1,000 females ages 15
to 17.
Source: Office of New Mexico Vital Records
and Health Statistics, Public Health Division,
New Mexico Department of Health (2002).
- There was considerable variation
in the teenage birth rate by race/ethnicity
in New Mexico. The Hispanic/Latina birth
rate in New Mexico counties within
62 miles of the Border was 69 per
1,000; this was somewhat higher than
the New Mexico rate for Hispanics/Latinas
of 64 births per 1,000 teenage women.
The higher teenage birth rate was reflected
in all race/ethnic categories except
Non-Hispanic Whites. The teenage birth
rate by race/ethnicity in New Mexico
was 30 per 1,000 for Blacks/African-Americans
and 12 per 1,000 among Non-Hispanic
White teenage women (Table 17).
- In comparison, the teenage birth rate
in New Mexico (37 per 1,000) was higher
than the overall Border States teenage
birth rate (29 per 1,000) and higher
than the U.S. teenage birth rate (18
per 1,000).
Healthy Border 2010 Objective for infant
deaths:
· Reduce the infant mortality rate
to 4.6 deaths per 1,000 live births
Infant
Mortality
| Healthy
Border 2010 Objective for infant
deaths:
- Reduce
the infant mortality rate to 4.6
deaths per 1,000 live births
|
Table 15 shows that in New Mexico the
infant mortality rate in 2002
was 6.1 deaths per 1,000 live births.
Source: Office of New Mexico Vital Records
and Health Statistics, Public Health Division,
New Mexico Department of Health (2002).
- For Non-Hispanic Whites and Hispanics/Latinos(as),
the infant mortality rate was 5.3 and
5.8, respectively.
- The Black/African-American infant
mortality rate was 12.7 deaths for each
1,000 live births. This reflects an
infant mortality rate that was more
than 2 times greater than occurs in
the Non-Hispanic White and Hispanic/Latino(a)
populations.
Infant mortality rates in 2002 for New
Mexico were higher for all racial/ethnic
groups than the Healthy Border 2010 Objective
of 4.6 deaths per 1,000 population. In
the counties within 62 miles of the
U.S.-Mexico Border, the infant mortality
rate is approaching the HB 2010 goal.
Mental
Health
| Healthy
Border 2010 Objective for mental
health:
- Reduce
the mortality rate for suicides
to 9.4 deaths per 100,000 population
|
Meeting mental health needs has been
identified as a national priority in the
United States. The National Action Agenda,
established by the Surgeon General, notes
specific action steps aimed at decreasing
the burden of mental illness including
promoting public awareness, supporting
mental health-related research, improving
early assessment, recognition and access
to care, and training appropriate personnel
to recognize and manage mental disorders.26
Hospitalizations for psychiatric-related
conditions occurred at the rate of
45 per 10,000 population in New Mexico’s
Border Counties in 2002; this was 2.4
times higher that the State rate of 18.6
per 10,000 population (Table 19).
- At the rate of 45 per 10,000 population,
hospitalizations for psychiatric related
conditions in New Mexico’s Border
Counties were higher than those of the
Border States (38 per 10,000).
- The counties between 62 and 300 miles
from the Border had the lowest rate
or hospitalization for psychiatric related
conditions in the State at 13.2 per
10,000.
Suicide takes a disproportionate toll
in the community as well as on the family
and friends of the deceased. It also results
in a significant loss of years of potential
life of a productive community member.
Suicide was the eighth leading cause of
death in New Mexico27
and the eleventh in the United States28.
- Table 19 shows that the New Mexico
2002 age-adjusted suicide mortality
rate was 19.1 deaths per 100,000 population.
This was almost twice the Border States
and the U.S. rates (10.9 per 100,000
each).
- In the two counties more than
300 miles from the Border, the
suicide mortality rate was 36 per 100,000;
this was 1.9 times the State suicide
mortality rate. This resulted in 926
years of life lost in 2002 per 100,000
population, twice the State rate and
4 times the rate for the Border States.
- In New Mexico, suicide resulted in
the loss of 479 years of life lost per
100,000 population; this was twice the
number of years of potential life lost
due to suicide in the Border States.
Oral
Health
| Healthy
Border 2010 Objective for oral health:
- Increase
the use of oral care system to
75 percent
|
“You are not healthy without good
oral health,” noted Dr. C. Everett
Koop, former U.S. Surgeon General.29
The importance of meeting oral health
care needs in communities in the Border
Counties, Border States and nationwide
is increasing as research continues to
link oral health with general well-being.
Oral infection has been associated with
the onset and severity of systemic diseases
such as cardiovascular disease and diabetes,
and negative birthing outcomes.30
Despite increased use of dental sealants
and water fluoridation, preventable oral
diseases still afflict many children and
adults during their lifetimes, impacting
their self-image and quality of life as
well as compromising their health and
well-being.30
Disparities in access to preventative
and therapeutic oral care are demonstrated
by the unmet needs of those with lower
income and education levels, underserved
populations, and a notable proportion
of untreated tooth decay (over 40 percent
in persons between 2 and 19 years, and
approximately 90 percent of adults) observed
in individuals regardless of sociodemographic
characteristics.31
While it is now possible to maintain healthy
teeth throughout a lifetime, currently
available preventive measures, knowledge,
and technologies must be utilized universally
by professionals and consumers alike.32
| Healthy
Border 2010 Objective for oral health
includes these essential services:
- Treatment
of dental cavities
- Preventive services such
as dental sealants
- Dental restorative treatments
such as replacement of permanent
teeth
- Screening and diagnosis
of oral and pharyngeal cancers
- Identification and referral
for treatment of oral birth defects,
such as cleft lip and cleft palate
|
Information collected in the Behavioral
Risk Factor Surveillance System (BRFSS)
results from answers to the question,
“Have you visited the dentist or
dental clinic within the past year for
any reason?”
- Results indicate that, in 2002, New
Mexico residents were 10 percent below
the HB 2010 goal of 75 percent of the
population visiting a dentist each year
(Table 20). Sixty-five percent of adults
in New Mexico had visited a dentist
or dental clinic within a past year.
This was consistent with other Border
States (66 percent) and the U.S. (70
percent).
Source: Behavioral Risk Factor Surveillance
System (2002).
Asthma
| Healthy
Border 2010 Objective for asthma:
- Reduce the
hospital discharge rate to 5.2
per 10,000 population
|
In 2002, 11.7 percent of New Mexico respondents
to the BRFSS reported that they had been
diagnosed as ever having asthma by a health
professional.
- The highest prevalence of asthma
in New Mexico (12.3 percent) was reported
among residents in the New Mexico Border
Counties (Table 21).
- In 2002, the asthma hospitalization
rate (9.9 per 100,000) for New Mexico
was almost twice the HB 2010 goal. For
counties within 62 miles of the
U.S.-Mexico Border, the asthma
hospitalization rate (6.8 per 100,000)
was above the HB 2010 goal.
- The hospitalization rate reflects
only cases that are severe enough to
be admitted to the hospital, not cases
that made their presence in the emergency
department, treated and released.
- Death due to asthma is a relatively
rare cause of death; the age-adjusted
mortality rate for New Mexico was 1.6
deaths per 100,000 population. This
rate was similar to the Border States
and U.S. rates and was consistent across
New Mexico.
|
|