|
|
 |
How To... - Read A Data Table - Trend Tables
Health Indicator by Demographic Variable
Use
Use the PedNSS and PNSS Health Indicator by Demographic
Variable trend tables to identify increases or decreases in the prevalence
of health indicators over time for specific race/ethnicity or age groups.
PedNSS Health Indicator by Demographic Variable Trend tables include:
- Table 18, Summary of Trends in Growth and Anemia Indicators by
Race/Ethnicity
- Table 19, Summary of Trends in Breastfeeding Indicators by
Race/Ethnicity
- Table 20, Summary of Trends in Growth Indicators by Age
- Table 21, Summary of Trends in Anemia Indicators by Age
PNSS Health Indicator by Demographic Variable Trend tables include:
- Table 20, Summary of Trends in Maternal Health Indicators by
Race/Ethnicity
- Table 21, Summary of Trends in Maternal Behavioral Indicators by
Race/Ethnicity
- Table 22, Summary of Trends in Smoking Indicators by Race/Ethnicity
- Table 23, Summary of Trends in Infant Health Indicators by
Race/Ethnicity
These tables can be used to answer questions such as:
- What racial/ethnic group has the higher prevalence of anemia?
- Is anemia increasing or decreasing over time in this group?
Interpreting the Data
The following paragraphs provide general information about the table
data that will help you with interpretation.
Title
For PedNSS and PNSS, the table titles show the health indicator or group of
health indicators that are analyzed in
the table.
For PNSS, the table title includes a group of health indicators but only
selected health indicators are included in the group.
Review the PNSS table titles.
Sample: PedNSS Table 18C, Summary of Trends in Growth and Anemia Indicators by
Race/Ethnicity
We're going to look at sections of the PedNSS Table 18C Summary of
Trends in Growth and Anemia
Indicators by Race/Ethnicity. You can click on the View
Sample Table link below each portion to review the entire table. The sample
table is numbered to match the portions shown below.
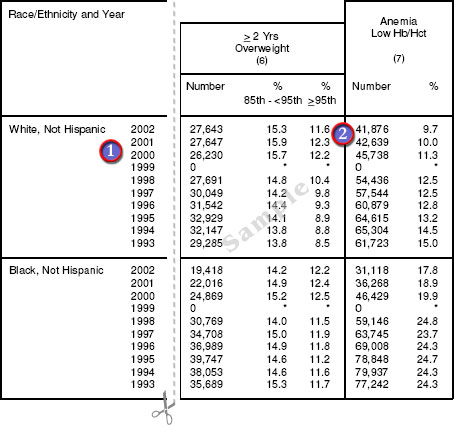
Trends in Anemia and Overweight
 |
Data start with the most recent year for the 10-year
period. |
 |
Although Anemia prevalence is higher among
Black, Not Hispanic children than among White, Not Hispanic
children, anemia decreased in both groups over the 10-year period.
The prevalence of Overweight (defined as > 95th) among children
>2 years of age increased in the White, Non-Hispanic group and
remained stable in the Black, Non-Hispanic group. |
Review the definition of
Birthweight and
its prevalence calculation.
Review the definition of
Growth Indicators and
its prevalence calculation.
Review the definition of
Anemia and
its prevalence calculation.
back to top
|
|