|
|
|
|
 |
||||||||||
|
|
|
|
|||||||||||||
|
||||||||||||||||
|
|
How To... - Read A Data Table - Demographic Tables
|
|||||||||||||||||||||||||||||||||||||||||||||||||||||||||||||||||||||||||||||||||||||||||||||||||
|
|||||||||||||||
Use the PedNSS and PNSS Summary of Demographic Indicators tables to determine the demographic characteristics of the population.
PedNSS Summary of Demographic Indicators tables include:
PNSS Summary of Demographic Indicators tables include:
These tables can be used to answer questions such as:
The following paragraphs provide general information about the table data to help you with interpretation.
Records
Total records included in the demographic tables represent the total
number of unique children or women that were examined in the public health
program during the reporting period.
Source of Data
The Source of Data is the public health program that collected the data.
Race/Ethnic and Age Distributions
The Race/Ethnic and Age Distributions are used to describe characteristics
of the population and to examine differences in the prevalence of health
indicators across populations or over time.
Socioeconomic Status Indicators
Education level, poverty level, and migrant status are indicators of
socioeconomic status that are also associated with prevalence rates.
Program Participation
Program participation describes what other healthcare and food resources
are received by children, pregnant and postpartum women.
New Data Items
The following demographic indicators have recently been added to PedNSS:
Note that data for these indicators have not yet been submitted by all
PedNSS contributors. However, as these data are collected by contributors
and sent to the CDC, they will be included in the PedNSS tables.
The above items are currently collected in PNSS; and are now included in the
PNSS table analysis.
We're going to look at sections of the PedNSS Table 1C, Summary of Demographic Indicators. You can click on the View Sample Table link below each portion to review the entire table. The sample table is numbered to match the portions shown below.
|
|
Individual Children (205,829) is the number of unique children
for which data are reported. Total Records (All Visits) is the total number of visits (303,290) for all children during the same reporting period. Data presented in all tables represents the individual or unique children and not the number of visits for all children. Compare the number of Individual Children for the current year to the previous year report to determine consistency and accuracy of the data. If there is a change, does the increase or decrease seem appropriate? |
|
|
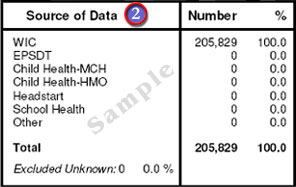
In this instance, all records included in this table are from the WIC program. |
|
|
The Total rows for Race/Ethnicity Distribution indicate the number of records included in the
analysis. If a record is missing data for a variable that is being analyzed, the data is coded as Excluded Unknown. Excluded Unknown shows the number and percent of records that have unknown data and are excluded from the analysis. In this example, 479 (0.2%) records are missing race/ethnicity data. |
We're going to look at sections of the PNSS Table 1C, Summary of Demographic Indicators. You can click on the View Sample Table link below each portion to review the entire table. The sample table is numbered to match the portions shown below.
|
|
Total Records Accepted (3,628) is the number of
women with births or expected births during the reporting period of
January 1 through December 31 of 2001. This number is the total of the Complete (2,301), Prenatal (532) and Postpartum
(795) records. Compare the number of records for Complete, Prenatal, and Postpartum for the current year to the previous year report to determine consistency and accuracy of the data. If there is a change, does the increase or decrease seem appropriate? |
Review the definition of Complete, Prenatal and Postpartum records.
|
|
In this instance, all records
included in this table are from the WIC program. The Total rows for each demographic variable indicate the number of records included in the analysis for that variable. If a record is missing data on the variable that is being analyzed, the data is coded as unknown. Excluded Unknown shows the number and percent of records that have unknown data and are excluded from the analysis. |
|
|
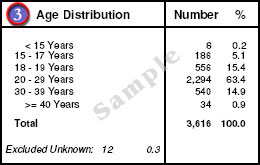
Note that the Age Distribution data is separated into two groups of young teens: very young teens (less than age 15 year) and teens 15 to 17 years of age, to closely monitor the number and % (percent) of births. Young teens are at high risk for poor birth outcomes. |
|
|
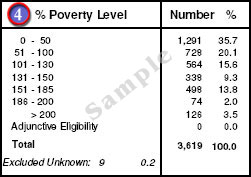
Note that the percent values for distribution data like % Poverty Level can be added together easily to create new categories for comparison. For example, some public health programs serve only individuals who are at or below 100% of the poverty level. To calculate the number and percent of women at 100% of poverty add the data for 0–50 and 51–100 together (1,291 + 728 = 2,019 or 35.7% + 20.1% = 55.8%). Adjunctive Eligibility is reported only when income cannot be reported in dollars. Adjunctive Eligibility for WIC is defined as documentation of current eligibility in other means-tested programs. |
|
|
The Program Participation is not a data distribution so a Total line is not provided. Note that adding the categories of program participation together does not produce a total of 100%. |