|
|
 |
How To... - Read A Data Table - Demographic Tables
Comparison of Demographic Indicators
Use
Use the Comparison of Racial and Ethnic Distribution and Comparison of
Age Distribution tables to compare one geographic area to another according to
age, racial/ethnic, or education distributions.
PedNSS Comparison of Demographic Indicators tables include:
- Table 4, Comparison of Racial and Ethnic Distribution
- Table 5, Comparison of Age Distribution
PNSS Comparison of Demographic Indicators tables include:
- Table 3, Comparison of Racial and Ethnic Distribution
- Table 4, Comparison of Age Distribution
These tables can be used to answer questions such as:
- What proportion of children less than 5 years old are Hispanic and
live in a specific county?
Sample: PedNSS Table 4B, Comparison of Racial and Ethnic Distribution
We're going to look at sections of the PedNSS Table4B, Comparison of
Racial and Ethnic Distribution. You can click on the View
Sample Table link below each portion to review the entire table. The sample
table is numbered to match the portions shown below.
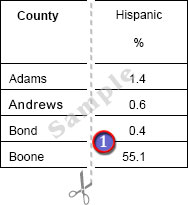
Racial and Ethnic Distribution by County
 |
The proportion of Hispanic children in Bond county is
0.4% compared to 55.1% in Boone county. The race/ethnic distribution by
county may help explain differences in the prevalence of some health
indicators from one county to another county. The
prevalence of overweight for these counties can be compared using data
from the PedNSS Table 6B Comparison of Growth and Anemia Indicators by
County below. |
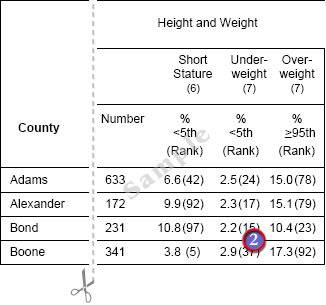
Comparison of Growth and Anemia Indicators by County
Compare the number of overweight children birth to 5 years of age
included in the analysis from PedNSS Table 4B, Comparison of Racial and Ethnic
Distribution by County to information from PedNSS Table 6B
Comparison of Growth and Anemia Indicators by County, shown below.
 |
The prevalence of overweight for children birth to 5
years of age in Bond county is 10.4% compared to 17.3% in Boone county. Because Hispanic
children have the highest prevalence of overweight for all race/ethnic
groups in the national PNSS, the higher proportion of Hispanic children in Boone county may
have resulted in the higher overall prevalence of overweight for this
county compared to Bond county. |
back to top
|
|