
|
 |
|
|
GIS Research & Applications | GIS Database Development | Spatial Data Analysis | Geovisualization Tools Development | Communication of Georeferenced Statistics Geovisualization Tools DevelopmentAs part of a broader program of data visualization research, NCI staff and their collaborators have developed a number of methods to better communicate cancer statistics visually, such as by maps and new graph designs. Examples of work in this area are:
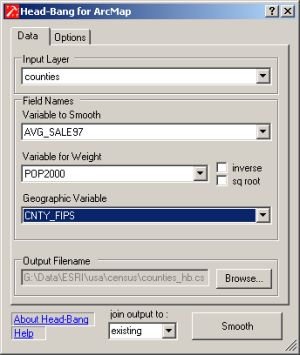
Weighted Nonparametric Smoothing (Headbanging)"Head-banging" is a weighted two-dimensional median-based smoothing algorithm, developed to reveal underlying geographic patterns in data where the values to be smoothed do not have equal variances. The Head-Bang software helps users apply this algorithm to data.
Tools implemented as ArcGIS Extensions
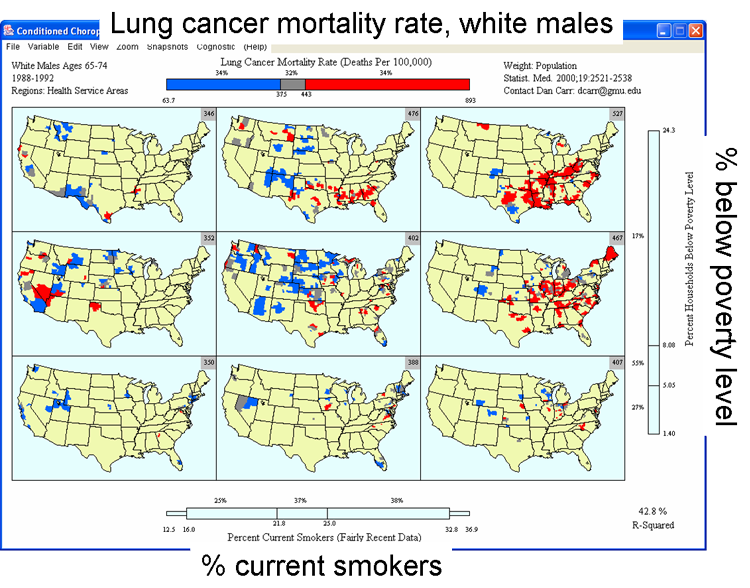
Conditioned choropleth maps
Linked micromap plot
Combining Statistical Clustering Algorithms with New Visualization Tools
Alan MacEachren, Penn State University (www.geovista.psu.edu) GIS Research & Applications | GIS Database Development | Spatial Data Analysis | Geovisualization Tools Development | Communication of Georeferenced Statistics |
||||||||||
|
Maintained by the Surveillance Research Program,
Division of Cancer Control & Population Sciences. Contact Us | Accessibility Feedback | Privacy Policy |
|
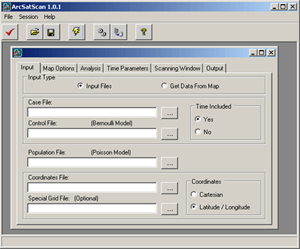
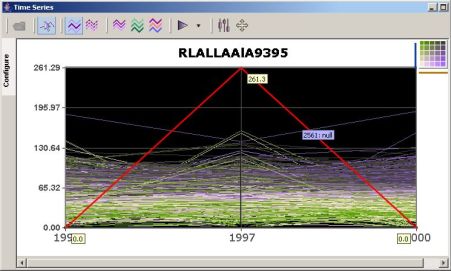
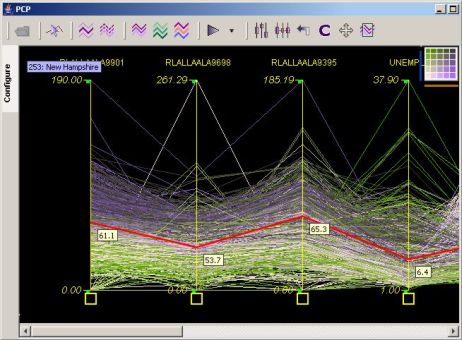
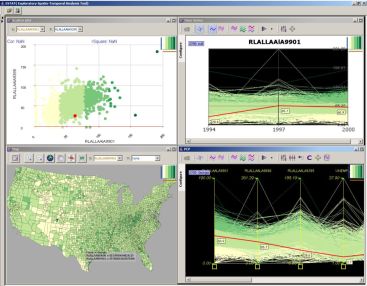 Exploratory Spatio-Temporal Analysis Tool (ESTAT):