|
| Attention-Deficit / Hyperactivity Disorder (ADHD) |
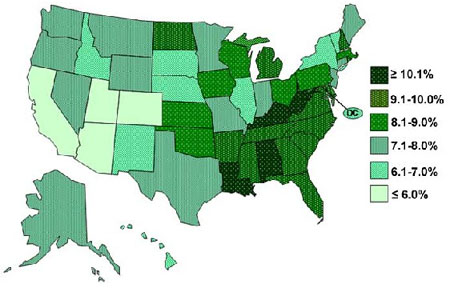
Prevalence of Parent Reported ADHD Diagnosis, 2003 |
Prevalence of Parent-Reported Medication
Treatment for ADHD, 2003 |
See
Full Report
Percent of Youth 4-17 ever diagnosed with
Attention-Deficit/Hyperactivity Disorder: National Survey of
Children's Health, 2003
| State |
Diagnosed |
State |
Diagnosed |
State |
Diagnosed |
| US |
7.74 |
Louisiana |
10.31 |
Oklahoma |
8.11 |
| Alabama |
11.09 |
Maine |
7.92 |
Oregon |
7.15 |
| Alaska |
7.07 |
Maryland |
9.11 |
Pennsylvania |
8.17 |
| Arkansas |
9.88 |
Massachusetts |
8.51 |
Rhode Island |
9.81 |
| Arizona |
5.89 |
Michigan |
9.21 |
South Carolina |
9.98 |
| California |
5.34 |
Minnesota |
7.53 |
South Dakota |
6.49 |
| Colorado |
4.95 |
Mississippi |
9.59 |
Tennessee |
9.87 |
| Connecticut |
7.38 |
Missouri |
7.67 |
Texas |
7.69 |
| Delaware |
9.74 |
Montana |
7.09 |
Utah |
5.49 |
| Florida |
9.21 |
Nebraska |
6.39 |
Vermont |
6.90 |
| Georgia |
9.37 |
Nevada |
7.22 |
Virginia |
9.28 |
| Hawaii |
6.14 |
New Hampshire |
9.14 |
Washington |
7.18 |
| Idaho |
6.38 |
New Jersey |
7.22 |
Washington, DC |
6.74 |
| Illinois |
6.32 |
New Mexico |
6.10 |
West Virginia |
10.08 |
| Indiana |
7.93 |
New York |
6.27 |
Wisconsin |
8.06 |
| Iowa |
8.35 |
North Carolina |
9.54 |
Wyoming |
7.13 |
| Kansas |
8.14 |
North Dakota |
9.39 |
|
|
| Kentucky |
10.12 |
Ohio |
8.88 |
|
|
|
[Return
to Top]
Date: September 20, 2005
Content source: National Center on Birth Defects and Developmental
Disabilities
|
|
|