Department of Health and Human Services
Centers for Disease Control and Prevention
|
|
||||||||||||||||
|
|
|
|
|
|||||||||||||
|
|
Control and Prevention Division of Cancer Prevention and Control 4770 Buford Hwy, NE MS K-64 Atlanta, GA 30341-3717 Call: 1 (800) CDC-INFO TTY: 1 (888) 232-6348 FAX: (770) 488-4760 E-mail: cdcinfo@cdc.gov Submit a Question Online |
|
|
|
Rates of Getting Skin Cancer by StateThe number of people who get skin cancer is called the skin cancer incidence. In the United States, the risk of getting skin cancer varies from state to state. Melanoma of the Skin Incidence Rates,* by State, 2004† 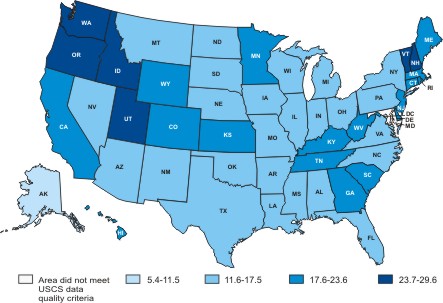 The incidence rates for Alaska and the District of Columbia are in the first interval (5.4 to 11.5 per 100,000) for the melanoma of the skin incidence rates. The states with incidence rates in the second interval (11.6 to 17.5 per 100,000) include Alabama, Arizona, Arkansas, Florida, Illinois, Indiana, Iowa, Louisiana, Michigan, Mississippi, Missouri, Montana, Nebraska, Nevada, New Mexico, New York, North Carolina, North Dakota, Ohio, Oklahoma, Pennsylvania, South Dakota, Texas, Virginia, and Wisconsin. The states with incidence rates in the third interval (17.6 to 23.6 per 100,000) include California, Colorado, Connecticut, Delaware, Georgia, Hawaii, Kansas, Kentucky, Maine, Massachusetts, Minnesota, New Jersey, Rhode Island, South Carolina, Tennessee, West Virginia, and Wyoming. The states with incidence rates in the fourth interval (23.7 to 29.6 per 100,000) include Idaho, New Hampshire, Oregon, Utah, Vermont, and Washington. Maryland did not meet the USCS data quality criteria, which are based on an assessment for all invasive cancer sites combined. Please note that delays in reporting melanoma cases to cancer registries are more common since they are usually diagnosed and treated in non-hospital settings such as physician offices. *Rates are per 100,000 and are age-adjusted to the 2000 U.S. standard population. Deaths from Skin Cancer by StateRates of dying from skin cancer also vary from state to state. Melanoma of the Skin Death Rates,* by State,† 2004 ‡ 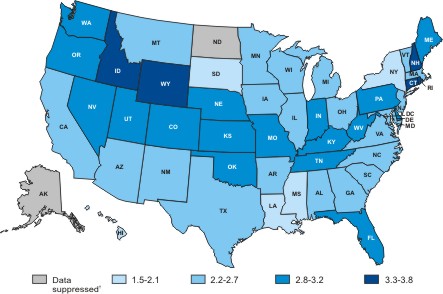 The melanoma of the skin death rates for Alaska, the District of Columbia, and North Dakota are suppressed since there were fewer than 16 cases reported in 2004. The states with death rates in the first interval (1.5 to 2.1 per 100,000) include Hawaii, Louisiana, Mississippi, New York, and South Dakota. The states with death rates in the second interval (2.2 to 2.7 per 100,000) include Alabama, Arizona, Arkansas, California, Georgia, Illinois, Iowa, Maryland, Massachusetts, Michigan, Minnesota, Montana, New Jersey, New Mexico, North Carolina, Ohio, South Carolina, Texas, Vermont, Virginia, and Wisconsin. The states with death rates in the third interval (2.8 to 3.2 per 100,000) include Colorado, Delaware, Florida, Indiana, Kansas, Kentucky, Maine, Missouri, Nebraska, Nevada, Oklahoma, Oregon, Pennsylvania, Tennessee, Utah, Washington, and West Virginia. The states with death rates in the fourth interval (3.3 to 3.8 per 100,000) include Connecticut, Idaho, New Hampshire, Rhode Island, and Wyoming. *Rates are per 100,000 and are age-adjusted to the 2000 U.S. standard population. ‡ Source: U.S. Cancer Statistics Working Group. United States Cancer Statistics: 2004 Incidence and Mortality. Atlanta (GA): Department of Health and Human Services, Centers for Disease Control and Prevention, and National Cancer Institute; 2007.
Page last reviewed: June 6, 2008
Page last updated: June 6, 2008 Content source: Division of Cancer Prevention and Control, National Center for Chronic Disease Prevention and Health Promotion |
|
||||||||||||||||||||||||||||||||||||||||||||||||||||||||||||||
|
|
|
||||||||||||
|