Water-Soluble Vitamins &
Related Biochemical
Compounds
In This Section
Folate (serum and red blood cell), Vitamin B12, Homocysteine, Methylmalonic acid
Background
Folate and vitamin B12 belong to the group of water-soluble B vitamins that occur naturally in food. Leafy green vegetables (such as spinach and turnip greens), fruits (such as citrus fruits and juices), and dried beans and peas are all natural sources of folate. Folic acid is the synthetic form of folate found in supplements and added to fortified foods. Because of wide consumption of fortified foods in the United States, these products have become an important contributor of folic acid to the U.S. diet. Folate functions as a coenzyme in single-carbon transfers in the metabolism of nucleic and amino acids and is therefore especially important during periods of rapid cell division and growth, such as occurs during infancy and pregnancy.
Vitamin B12 (cobalamin) is found naturally in animal foods including fish, meat, poultry, eggs, milk, and milk products. For vegetarians, fortified breakfast cereals are a particularly valuable source of vitamin B12. Vitamin B12 functions as a coenzyme for a critical methyl transfer reaction that converts homocysteine to methionine and for a separate reaction that converts L-methylmalonyl-coenzyme A to succinyl-coenzyme A.
Homocysteine (Hcy) is an amino acid naturally found in the blood. Plasma Hcy concentrations are strongly influenced by diet as well as by genetic factors. Elevated concentrations are found in people whose folate, vitamin B12, or vitamin B6 status is suboptimal (Selhub 1993), and in people with impaired renal function (Wollensen 1999).
Methylmalonic acid (MMA) is a dicarboxylic acid naturally found in the blood. Plasma MMA concentrations are elevated when serum vitamin B12 concentrations are low or intermediate and are therefore a useful diagnostic test for confirming vitamin B12 deficiency (Baik 1999).
A chronic dietary deficiency of either folate or vitamin B12 causes macrocytic anemia, although strict dietary deficiencies are rare. Certain drugs (e.g., alcohol, methotrexate, anticonvulsants, sulfa drugs) may interfere with the absorption or utilization of folate, and disorders of the small bowel that limit absorption (e.g., Crohn’s disease, jejunal bypass surgery) can cause folate deficiency (Halsted 1990). Most people who develop a vitamin B12 deficiency have an underlying stomach or intestinal disorder that limits the absorption of vitamin B12. Subtly reduced cognitive function resulting from early vitamin B12 deficiency is sometimes the only symptom of these intestinal disorders. Severe vitamin B12 deficiency can cause permanent nerve damage and dementia. Hematologic signs, however, are not always present in vitamin B12 deficiency and hematologic signs and neurologic abnormalities can be inversely correlated (Baik 1999).
Clinical trials have shown that folic acid supplementation effectively reduces the number of neural tube birth defects (NTDs) (Czeizel 1992; MRC Vitamin Study Research Group 1991). Thus, CDC and the U.S. Public Health Service have recommended that every woman who could become pregnant consume at least 400 micrograms (µg) of folic acid each day (U.S. Centers for Disease Control and Prevention 1992). Since 1998, the U.S. Food and Drug Administration (FDA) has required the addition of folic acid to enriched breads, cereals, flours, corn meals, pastas, rice, and other grain products (U.S. Food and Drug Administration 1996a). Recent observational studies have suggested potential benefits of the U.S. folic acid fortification, such as reduced NTD rates (Williams 2005), decreased prevalence of inadequate serum and RBC folate concentrations (Pfeiffer 2005), and declines in the incidence of stroke (Yang 2006) and neuroblastoma (French 2003). Potential roles are currently being studied for 1) folate in altering the risks for heart disease and cancer, 2) vitamin B12 in modulating the risks for cognitive impairment, and 3) Hcy as a risk factor for or a marker of cardiovascular disease.
The recommended dietary allowance (RDA) for both men and women is 400 µg per day of dietary folate equivalents (DFEs). DFEs adjust for the nearly 50 percent lower bioavailability of dietary folate compared with the bioavailability of folic acid: 1 µg of dietary folate equivalent equals 0.6 µg of folic acid from fortified food or from a supplement taken on an empty stomach (Institute of Medicine 1998). The RDA for vitamin B12 for adults is 2.4 µg per day. Because as many as 10 to 30 percent of older people may be unable to absorb naturally occurring vitamin B12, it is advisable for people older than 50 years to meet their RDA mainly by consuming foods fortified with vitamin B12 or by taking a supplement containing vitamin B12. People with vitamin B12 deficiency caused by a lack of intrinsic factor or intestinal malabsorption require parenteral B12 treatment (Institute of Medicine 1998).
Excess folic acid may mask and potentially delay diagnosis of anemia among people with vitamin B12 deficiency resulting in increased risk for neurological damage. Consequently, the Institute of Medicine (1998) recommends that folic acid intake for adults (aged 19 years and older) not exceed 1000 µg per day. Because no data were available for children, the Institute of Medicine used the level for adults adjusted by weight: 300–800 µg per day, depending on the age group. Folate intake from food is not associated with any health risk.
Clinical laboratories typically use conventional units for measuring concentrations of folate (nanograms per milliliter [ng/mL]) and vitamin B12 (picograms [pg]/mL) but use international system (SI) units for Hcy and MMA (micromole per liter [µmol/L]). Conversion factors to SI units are as follows: 1 ng/mL = 2.266 nanomol (nmol)/L for folate and 1 pg/mL = 0.738 picomol (pmol)/L for vitamin B12.
Several methods measure concentrations in blood of these B vitamins and related biochemical compounds. Because of significant differences in measuring folate concentrations, caution should be used when comparing other data sets with the tables in this report. Method-specific cut-off values and reference ranges should be used in medical diagnostics (Life Sciences Research Office 1994). Folate data presented in this report were generated using the BioRad Quantaphase II radioassay. This assay measures approximately 35 percent lower than the microbiologic gold-standard assay (Life Sciences Research Office 1994). As a result, for this report, the conventional cut-off values of less than 3 ng/mL for low serum folate concentrations and less than 140 ng/mL for low red blood cell (RBC) folate concentrations (Life Sciences Research Office 1984) should be adjusted to less than 2 ng/mL and less than 95 ng/mL, respectively. Common methods for measuring serum vitamin B12, plasma Hcy, and MMA generally produce comparable results. A widely used cut-off value for low serum vitamin B12 concentrations is 200 pg/mL (Gibson 1990). Generally used cut-off values for elevated concentrations of plasma Hcy and MMA are 13 µmol/L (Jacques 1999) and 0.37 µmol/L (Hølleland 1999), respectively.
More information on water–soluble vitamins and related biochemical compounds is available online:
- American Society for Nutrition fact sheets*
- Institute of Medicine's Dietary Reference Intake report*
- National Institutes of Health fact sheets:
One national health objective for Healthy People 2010 is to increase the proportion of pregnancies for which RBC folate concentration is optimum by increasing the median RBC folate concentration to 220 ng/mL among women aged 15–44 years (objective 16.16b; U.S. Department of Health and Human Services 2000).
Monitoring the folate status of the U.S. population over time has been a priority since serum and RBC folate results from NHANES II (1976–1980) (Senti 1985) and NHANES III (1988–1994) (Wright 1998) suggested that the folate status of some population groups might be of public health concern. Vitamin B12 status of the U.S. population has been monitored since the second phase of NHANES III (1991–1994) (Wright 1998). In a recent (2007) study, Pfeiffer et al. showed that, in women of childbearing age, the introduction of folic acid fortification has dramatically lowered the prevalence of low serum (< 3 ng/mL) and RBC folate concentrations (< 140 ng/mL) from 21 percent and 38 percent, respectively, to less than 1 percent and 5 percent, respectively. Serum vitamin B12 concentrations, however, did not change appreciably. Circulating Hcy concentrations from prefortification to postfortification decreased by approximately 10 percent in a national sample of the U.S. population (Pfeiffer 2008).
Selected Observations and Highlights
The following representative observations are taken from the tables of 1999–2002 data contained in this report. Statements about categorical differences between demographic groups noted below are based on non-overlapping confidence limits from univariate analysis without adjusting for demographic variables (e.g., age, sex, race/ethnicity) or other blood concentration determinants (e.g., dietary intake, supplement usage, smoking, BMI). A multivariate analysis may alter the size and statistical significance of these categorical differences. Furthermore, additional significant differences of smaller magnitude may be present despite their lack of mention here (e.g., if confidence limits slightly overlap or if differences are not statistically significant before covariate adjustment has occurred). For a selection of citations of descriptive NHANES papers related to these biochemical indicators of diet and nutrition, see Appendix E.
General Observations
- Serum and RBC folate concentrations show a U-shaped age pattern with higher concentrations in children and older people (≥ 60 years) than in young or middle-aged adults.
- Serum vitamin B12 concentrations first decline from childhood to middle-age, then stabilize. Plasma MMA concentrations are similar across all age groups, except that older people have higher concentrations.
- Plasma Hcy concentrations increase with age.
- Women have higher serum and RBC folate concentrations than do men, and men have higher plasma Hcy and MMA concentrations.
- For serum and RBC folate, non-Hispanic whites have higher concentrations than do Mexican Americans, who themselves have higher concentrations than do non-Hispanic blacks.
- Serum vitamin B12 concentrations are higher in non-Hispanic blacks than in the other two racial/ethnic groups, and plasma MMA concentrations are higher in non-Hispanic whites than in either Mexican Americans or in non-Hispanic blacks.
- Plasma Hcy concentrations are higher in non-Hispanic whites than in the other two racial/ethnic groups.
- Less than 5 percent of adolescent and adult women have low serum (< 2 ng/mL) and RBC folate concentrations (< 95 ng/mL)–cut-off values indicative of inadequate folate status (based on 5th percentile).
- Approximately 5 percent of older people have moderately low concentrations of serum vitamin B12 (< 200 pg/mL) (based on 5th percentile), and over 5 percent of older people have elevated concentrations of plasma Hcy (> 13 µmol/L) and of MMA (> 0.37 µmol/L) (based on 95th percentile).
Highlights
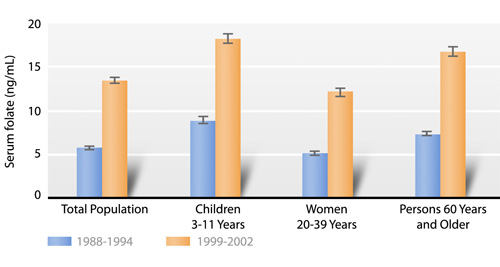
Since 1998, when fortification of enriched grains and cereal products with folic acid became mandatory, serum folate concentrations have more than doubled, and RBC folate concentrations have increased by about 50 percent in all population subgroups (Fig. 1.a). This greater than expected increase in blood concentrations was shown previously (Pfeiffer 2007). Underreporting of foods consumed, increased consumer selection of folate-rich foods as a result of health claims, and increasing availability of the number and types of nonstandardized folate-fortified foods (e.g., breakfast cereals) could be some of the reasons for the greater than expected increase in blood concentrations (U.S. Food and Drug Administration 1996b).
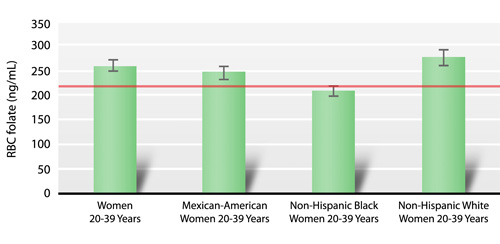
The Healthy People 2010 objective to increase the median RBC folate concentration in women to 220 ng/mL was achieved for Mexican-American and non-Hispanic white women aged 20–39 years: their median RBC folate concentrations were 250 ng/mL and 278 ng/mL, respectively (Fig. 1.b). This objective was, however, not achieved for non-Hispanic black women (210 ng/mL) (Fig. 1.b). Interestingly, offspring of non-Hispanic black women have the lowest incidence of NTDs, whereas offspring of Mexican-American women have the highest NTD incidence (Williams 2005). These findings show that RBC folate concentrations alone do not account for differences in NTD rates among race/ethnic groups in the U.S. population.
|
Median concentrations (95 percent confidence intervals) of red blood cell (RBC) folate among 20–39 year-old women by race/ethnicity, National Health and Nutrition Examination Survey, 1999–2002. |
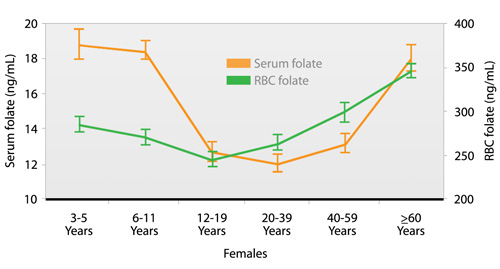
Although the majority (> 95 percent) of females have an adequate folate status, it is interesting to note that adolescents (aged 12–19 years) and adult women (aged 20–59 years), age groups for which good folate status is most critical, have lower serum folate concentrations than do females in other age groups (Fig. 1.c). Adolescent females aged 12–19 years also have lower RBC folate concentrations than do females in other age groups (Fig. 1.c).
|
Cross-sectional age pattern showing geometric mean concentrations (95 percent confidence intervals) of serum and red blood cell (RBC) folate in females, National Health and Nutrition Examination Survey, 1999–2002. |
Tables
Serum folate
- Table 1.1.a. Serum folate: Total population
- Table 1.1.b. Serum folate: Mexican Americans
- Table 1.1.c. Serum folate: Non-Hispanic blacks
- Table 1.1.d. Serum folate: Non-Hispanic whites
Red blood cell (RBC) folate
- Table 1.2.a. Red blood cell (RBC) folate: Total population
- Table 1.2.b. Red blood cell (RBC) folate: Mexican Americans
- Table 1.2.c. Red blood cell (RBC) folate: Non-Hispanic blacks
- Table 1.2.d. Red blood cell (RBC) folate: Non-Hispanic whites
Serum vitamin B12
- Table 1.3.a. Serum vitamin B12: Total population
- Table 1.3.b. Serum vitamin B12: Mexican Americans
- Table 1.3.c. Serum vitamin B12: Non-Hispanic blacks
- Table 1.3.d. Serum vitamin B12: Non-Hispanic whites
Plasma homocysteine
- Table 1.4.a. Plasma homocysteine: Total population
- Table 1.4.b. Plasma homocysteine: Mexican Americans
- Table 1.4.c. Plasma homocysteine: Non-Hispanic blacks
- Table 1.4.d. Plasma homocysteine: Non-Hispanic whites
Plasma methylmalonic acid
- Table 1.5.a. Plasma methylmalonic acid: Total population
- Table 1.5.b. Plasma methylmalonic acid: Mexican Americans
- Table 1.5.c. Plasma methylmalonic acid: Non-Hispanic blacks
- Table 1.5.d. Plasma methylmalonic acid: Non-Hispanic whites
References
Baik HW, Russel RM. Vitamin B12 deficiency in the elderly. Annu Rev Nutr. 1999;19:357-77.
Czeizel AE, Dudas I. Prevention of the first occurrence of neural-tube defects by periconceptional vitamin supplementation. N Engl J Med. 1992;327:1832-5.
French AE, Grant R, Weitzman S, Ray JG, Vermeulen MJ, Sung L, et al. Folic acid food fortification is associated with a decline in neuroblastoma. Clin Pharmacol Ther. 2003;74:288-94.
Gibson RS. Principles of nutritional assessment. New York: Oxford University Press; 1990.
Halsted CH. Intestinal absorption of dietary folates. In: Picciano MF, Stokstad ELR, Gregory JF, editors. Folic acid metabolism in health and disease. New York: Wiley-Liss, Inc.; 1990. p. 23-45.
Hølleland G, Schneede J, Ueland PM, Lund PK, Refsum H, Sandberg S. Cobalamin deficiency in general practice. Assessment of the diagnostic utility and cost-benefit analysis of methylmalonic acid determination in relation to current diagnostic strategies. Clin Chem. 1999;45:189-98.
Institute of Medicine, Food and Nutrition Board. Dietary reference intakes: thiamin, riboflavin, niacin, vitamin B6, folate, vitamin B12, pantothenic acid, biotin, and choline. Washington, D.C.: National Academy Press; 1998.
Jacques PF, Selhub J, Bostom AG, Wilson PF, Rosenberg IH. The effect of folic acid fortification on plasma folate and total homocysteine concentrations. N Engl J Med. 1999;340:1449-54.
Life Sciences Research Office, Center for Food Safety and Applied Nutrition. Assessment of the folate nutritional status of the U.S. population based on data collected in the Second National Health and Nutrition Survey, 1976–1980. Washington, D.C.: U.S. Food and Drug Administration, Department of Health and Human Services; 1984.
Life Sciences Research Office, Center for Food Safety and Applied Nutrition. Assessment of folate methodology used in the Third National Health and Nutrition Survey (NHANES 1988–1994). Washington, D.C.: U.S. Food and Drug Administration, Department of Health and Human Services; 1994.
MRC Vitamin Study Research Group. Prevention of neural tube defects: results of the Medical Research Council Vitamin Study. Lancet. 1991;338:131-7.
Pfeiffer CM, Caudill SP, Gunter EW, Osterloh J, Sampson EJ. Biochemical indicators of B vitamin status in the U.S. population after folic acid fortification: results from the National Health and Nutrition Examination Survey, 1999–2000. Am J Clin Nutr. 2005;82:442-50.
Pfeiffer CM, Johnson CL, Jain RB, Yetley EA, Picciano MF, Rader JI, Fisher KD, Mulinare J, Osterloh J. Trends in blood folate and vitamin B12 concentrations in the United States, 1988–2004. Am J Clin Nutr. 2007;86:718-27.
Pfeiffer CM, Osterloh JD, Kennedy-Stephenson J, Picciano MF, Yetley EA, Rader JI, Johnson CL. Trends in circulating concentrations of total homocysteine among US adolescents and adults: findings from the 1991–1994 and 1999–2004 National Health and Nutrition Examination Surveys. Clin Chem. 2008;54:801-13.
Selhub J, Jacques PF, Wilson PWF, Rush D, Rosenberg IH. Vitamin status and intake as primary determinants of homocysteinemia in an elderly population. JAMA. 1993;270:2693-8.
Senti FR, Pilch SM. Analysis of folate data from the Second National Health and Nutrition Examination Survey (NHANES II). J Nutr. 1985;115:1398–402.
U.S. Centers for Disease Control and Prevention. Recommendations for the use of folic acid to reduce the number of cases of spina bifida and other neural tube defects. Morb Mort Wkly Rep. 1992;41(No. RR-14):001.
U.S. Department of Health and Human Services. Healthy people 2010: understanding and improving health. 2nd ed. Washington, D.C.: U.S. Government Printing Office; November 2000.
U.S. Food and Drug Administration. Food standards: amendment of standards of identity for enriched grain products to require addition of folic acid. Final rule. Fed Regist. 1996a;61(44):8781–97.
U.S. Food and Drug Administration. Food labeling: health claims and label statements; folate and neural tube defects. Final rule. Fed Regist. 1996b;61(44):8752–81.
Williams LJ, Rasmussen SA, Flores A, Kirby RS, Edmonds LD. Decline in the prevalence of spina bifida and anencephaly by race/ethnicity: 1995-2002. Pediatrics. 2005;116:580–6.
Wollensen F, Brattstrom L, Refsum H, Ueland PM, Berglund L, Berne C. Plasma total homocysteine and cysteine in relation to glomerular filtration rate in diabetes mellitus. Kidney Int. 1999;55:1028–35.
Wright JD, Bialostosky K, Gunter EW, Carroll MD, Najjar MF, Bowman BA, et al. Blood folate and vitamin B12: United States, 1988-1994. National Center for Health Statistics. Vital Health Stat Series No. 11(243), 1998.
Yang Q, Botto LD, Erickson JD, Berry RJ, Sambell C, Johansen H, et al. Improvement in stroke mortality in Canada and the United States, 1990–2002. Circulation. 2006;113:1335–43.
Related Links
- American Society for Nutrition
Folate Fact Sheet* - IMMPaCt – Micronutrient Facts: Folic Acid
The problem of folic acid deficiency - Institute of Medicine Dietary Reference Intakes
Folate and Vitamin B12 Report* - National Center for Birth Defects and Developmental Disabilities (NCBDDD)
CDC Health Topic: Folic Acid - National Institutes of Health, Office of Dietary Supplements
Folate Fact Sheet
* Links to non-Federal organizations found at this site are provided solely as a service to our users. These links do not constitute an endorsement of these organizations or their programs by CDC or the Federal Government, and none should be inferred. CDC is not responsible for the content of the individual organization Web pages found at these links.
- Page last reviewed: July 30, 2008
- Page last updated: July 30, 2008
- Content source: Centers for Disease Control and Prevention, National Center for Environmental Health, Division of Laboratory Sciences
Contact Us:
- Centers for Disease Control and Prevention
1600 Clifton Rd
Atlanta, GA 30333 - 800-CDC-INFO
(800-232-4636)
TTY: (888) 232-6348
24 Hours/Every Day - cdcinfo@cdc.gov