|
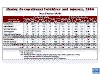
Table |
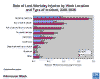
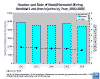
Number and Rate of
Lost-time Injuries in Mining by
Type of Employer, Commodity, and Work Location, 2002-2006 |
|
|
Table |
Number of Mining Nonfatal Lost-time Injuries and
Injury Rates by Commodity, Employer Type, and Mine Type, 2006 |
|
|
Table |
Number of Nonfatal Lost-time
Injuries, Number and Median Days Lost from Work, and Injury Rate in Mining by
Commodity and Employer Type, 2006 |
|
 |
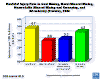
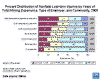
Mining Occupational Fatalities and Injuries, 2006 |
|
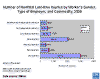
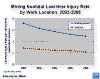
| Nonfatal Injury Rate in Coal Mining, Metal
Mineral Mining, Nonmetallic Mineral Mining, and All Industry (Private), 2006 |
 |
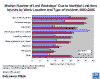
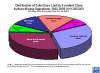
Number of Lost-Workday Injuries by Worker
Gender, Type of Employer, and Commodity, 2006 |
|
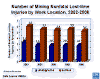 |
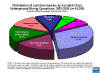
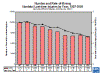
Number of Lost-time Injuries,
Underground and Surface Locations by Year, 2002-2006 |
 |
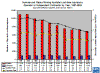
Lost-time Injury Rates,
Underground and Surface Locations by Year, 2002-2006 |
|
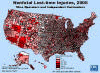 |
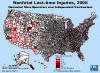
Number of Nonfatal Lost-time Injuries to Mine Operator
and Independent Contractor Employees by County, 2006 |
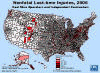 |
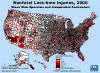
Number of Nonfatal Lost-time Injuries to
Coal
Mine Operator and Independent Contractor Employees by County, 2006 |
|
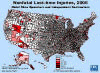 |
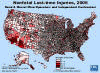
Number of Nonfatal Lost-time Injuries to Metal
Mine Operator and Independent Contractor Employees by County, 2006 |
 |
Number of Nonfatal Lost-time Injuries to Nonmetal
Mine Operator and Independent Contractor Employees by County, 2006 |
|
 |
Number of Nonfatal Lost-time Injuries to
Stone
Mine Operator and Independent Contractor Employees by County, 2006 |
 |
Number of Nonfatal Lost-time Injuries to
Sand and Gravel
Mine Operator and Independent Contractor Employees by County, 2006 |
|
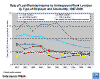 |
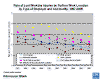
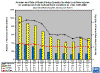
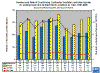
Rate of Lost-workday Injuries
for Underground Mining Operations by Type of Employer, Commodity, and Year,
1997-2006 |
 |
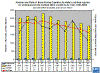
Rate of Lost-workday Injuries
for Surface Mining Operations by Type of Employer, Commodity, and Year,
1997-2006 |
|
 |
Rate of Lost-workday Injuries by Work Location
and Type of Incident for the 5-year Period 2002-2006 |
 |
Median Number of Lost Workdays Due to Nonfatal
Lost-time Injury by Work Location and Selected Types of Incident, 2002-2006 |
|
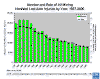 |
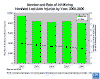
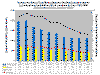
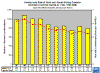
Number and Rate of All
Mining Nonfatal Lost-time Injuries by Year, 1987-2006 |
 |
Number and Rate of All Mining Nonfatal
Lost-time Injuries by Year, 2002-2006 |
|
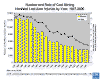 |
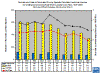
Number and Rate of Coal Mining Nonfatal
Lost-time Injuries by Year, 1987-2006 |
 |
Number and Rate of Coal Mining Nonfatal
Lost-time Injuries by Year, 2002-2006 |
|
 |
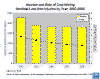
Number and Rate of
Metal/Nonmetal Mining Nonfatal Lost-time Injuries by Year, 1987-2006 |
 |
Number and Rate of
Metal/Nonmetal Mining Nonfatal Lost-time Injuries by Year, 2002-2006 |
|
 |
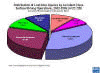
Distribution of Lost-time Injuries by Accident Class,
Underground
Mining, 2002-2006 |
 |
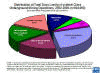
Distribution of Lost-time Injuries by Accident Class,
Surface
Locations, 2002-2006 |
|
 |
Distribution of Total Days Lost by Accident
Class, Underground Mining,
2002-2006 |
 |
Distribution of Total Days Lost by Accident
Class, Surface
Locations, 2002-2006 |
|
 |
Number and Rate of Mining
Nonfatal Lost-time Injuries by Year, 1997-2006 |
 |
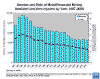
Number and Rate of Mining
Nonfatal Lost-time Injuries by Operator or Independent Contractor by Year,
1997-2006 |
|
 |
Number and Rate of Mining Nonfatal
Lost-time Injuries by Underground and Surface Work Locations by Year, 1997-2006 |
 |
Number and Rate of Coal
Mining Operator Nonfatal Lost-time Injuries by Underground and Surface Work
Locations by Year, 1997-2006 |
|
 |
Number and Rate of Metal
Mining Operator Nonfatal Lost-time Injuries by Underground and Surface Work
Locations by Year, 1997-2006 |
 |
Number and Rate of Nonmetal
Mining Operator Nonfatal Lost-time Injuries by Underground and Surface Work
Locations by Year, 1997-2006 |
|
 |
Number and Rate of Stone
Mining Operator Nonfatal Lost-time Injuries by Underground and Surface Work
Locations by Year, 1997-2006 |
 |
Number and Rate of Sand
and Gravel Mining Operator Nonfatal
Lost-time Injuries by Year, 1997-2006 |
|
 |
Number and Rate of Coal Mining Contractor
Nonfatal
Lost-time Injuries by Underground and Surface Work Locations by Year, 1997-2006 |
 |
Number and Rate of Noncoal Mining
Contractor Nonfatal
Lost-time Injuries by Underground and Surface Work Locations by Year, 1997-2006 |
|
|
|
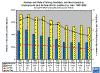
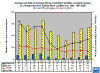
Distribution of Lost-workday Injuries by Years
of Total Mining Experience, Type of Employer, and Commodity, 2006 |
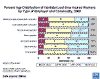 |
Distribution of Lost-workday Injuries by
Worker Age, Type of Employer, and Commodity, 2006 |
|
|
Table |
1983-2006--Number of Mining Fatalities
and Injuries by Year |
|
|
Table |
1983-2006--Number of
Mining Fatalities and Injuries by Year; Excludes Office Employees |
|
|
Table |
1983-2006--Number of Mining Fatalities
and Injuries by Underground/Surface Work Location by Year; Excludes Office
Employees |
|
|
Table |
1983-2006--Number of
Mining Fatalities and Injuries by Mining Commodity Sector by Year; Excludes
Office Employees |
|
|
Table |
1983-2006--Number of Mining Fatalities
and Injuries by Underground/Surface and Mining Commodity Sector by Year;
Excludes Office Employees |
|
|
Table |
1983-2006--Occupational Mining Fatality Rate and Nonfatal Lost-Time Injury Rate
by Year; Excludes Office Employees |
|
|
Table |
1983-2006--Occupational Mining Fatality
Rate and Nonfatal Lost-Time Injury Rate by Underground/Surface Work Location by
Year; Excludes Office Employees |
|
|
Table |
1983-2006--Occupational Mining Fatality Rate and Nonfatal Lost-Time Injury Rate
by Mining Commodity Sector by Year; Excludes Office Employees |
|
|
Table |
1983-2006--Occupational Mining Fatality
Rate and Nonfatal Lost-Time Injury Rate by Mining Commodity Sector and
Underground/Surface Work Location by Year; Excludes Office Employees |
|
|
Table |
1983-2006--Number of
Occupational Fatalities, Nonfatal Injuries, and Cases of Occupational
Illness |
|
|
Table |
1983-2006--Number of
Occupational Fatalities, Nonfatal Injuries, and Cases of Occupational Illness;
Excludes Office Employees |
|
|
Table |
1983-2006--Number of
Occupational Fatalities, Nonfatal Lost-time Injuries, Injuries with no days
lost, and Nonoccupational Fatalities by Mining
Sector |
|
|
Table |
1983-2006--Number of Occupational Fatalities, Nonfatal Injuries, and Cases of Occupational Illness by
Mining Sector |
|
|
Table |
1983-2006--Number of
Occupational Fatalities, Nonfatal Injuries, and Cases of Occupational
Illness by Mining Sector; Excludes Office Employees |
|
|
Table |
2006--Number of Lost Work Days (Statutory, Restricted Activity, Actual, and
Total) by Injury Type (Occupational Fatality, Nonfatal Injury, and Occupational
Illness) |
|
|
Table |
2006--Number of Lost
Work Days (Statutory, Restricted Activity, Actual, and Total) by Type
(Occupational Fatality, Nonfatal Injury, and Occupational Illness); Excludes
Office Employees |