| Federal
R&D Performance
Federal R&D Funding by National Objective
R&D by Federal Agency
Federal R&D Funding by Performer and Field of
Science or Engineering
Federal R&D Tax Credit
When Nelson (1959) and Arrow (1962) first laid out their seminal
economic arguments that the private sector generally invests less
than the socially optimal amount in R&D, the Federal Government
funded almost twice as much R&D as did the private sector. Since
then these relative positions have reversed, but the argument in
support of public funding for R&D is still valid more than 40
years later. Briefly, the argument is that the returns on investment
in R&D cannot be fully appropriated by an investor because of
the very nature of the primary output of R&D: knowledge. This
being the case, firms will only invest in those R&D projects
from which, through secrecy, patents, or some other means, they
are able to recoup their investment plus an acceptable profit. The
government endeavors to correct this market failure through a number
of policy measures, the most direct of which is the funding and
performance of R&D that would not or could not be financed or
performed in the private sector. Thus, despite its declining share
in total R&D funding, the Federal Government still supports
the majority of basic research in the United States. This section
examines the Federal Government's role in performing, funding, and
stimulating R&D in the private sector through tax policy.
Federal R&D Performance 
Federal laboratories and FFRDCs performed $34.1 billion of total
U.S. R&D in 2002, an average annual increase in real terms of
10.4 percent from the 2000 level of $27.1 billion. Among individual
agencies, DOD continued to perform the most intramural R&D and
is expected to account for more than half of all Federal obligations
for intramural R&D in the future. In fiscal year 2003, DOD is
expected to perform more than twice the R&D of the second largest
R&D-performing agency, the Department of Health and Human Services
(HHS), which performs most of its intramural R&D at the National
Institutes of Health (NIH) (table
4-10  ). ).
The Department of Energy (DOE) sponsors the most FFRDCs of any
agency—16 of the 36. These 16 FFRDCs performed a total of $7.5 billion
of R&D in FY 2001, approximately three-fourths of all the R&D
performed by FFRDCs (appendix
table 4-26  ).
First established during World War II, FFRDCs are unique organizations
that help the United States government meet special long-term research
or development goals that cannot be met as effectively by in-house
or contractor resources. (See sidebar, "Rationales
for Federal Laboratories and FFRDCs.") According to the Federal
Register, an FFRDC is required "to operate in the public interest
with objectivity and independence, to be free from organizational
conflicts of interest, and to have full disclosure of its affairs
to the sponsoring agency" (NARA 1990). Total R&D performed by
all FFRDCs (estimated at $10.3 billion in 2002) has grown at a real
annual rate of 4.5 percent from its level of $9.1 billion in 2000. ).
First established during World War II, FFRDCs are unique organizations
that help the United States government meet special long-term research
or development goals that cannot be met as effectively by in-house
or contractor resources. (See sidebar, "Rationales
for Federal Laboratories and FFRDCs.") According to the Federal
Register, an FFRDC is required "to operate in the public interest
with objectivity and independence, to be free from organizational
conflicts of interest, and to have full disclosure of its affairs
to the sponsoring agency" (NARA 1990). Total R&D performed by
all FFRDCs (estimated at $10.3 billion in 2002) has grown at a real
annual rate of 4.5 percent from its level of $9.1 billion in 2000.
Federal R&D Funding by National Objective
In 2002 the Federal Government funded approximately twice as much
R&D as that performed in Federal labs and FFRDCs. This support
is estimated to be $78.2 billion, reflecting a 6.7 percent average
real increase per year since 2000. This funding supports a wide
range of national objectives (also termed budget functions);
is administered by many Federal agencies; and flows to R&D performers
in all sectors, from industry to universities and colleges and to
nonprofit organizations.
Defense-Related R&D
Defense-related R&D, as a proportion of the nation's total
R&D, has shifted substantially. From 53.6 percent in 1959, it
declined to a relative low of 24.3 percent in 1980, climbed to 31.7
percent by 1987, and, coinciding with the end of the cold war, fell
substantially afterward, reaching a low of 13.5 percent in 2000
(figure 4-8  ).
Despite this dramatic decline relative to nondefense R&D, the
absolute level of defense R&D in 2000 still exceeded that in
any year from 1953 to 1982, after adjusting for inflation. In 2000,
defense-related R&D as a share of U.S. R&D began to grow
again, subsequently reaching 14.9 percent of the nation's total
R&D in 2002. ).
Despite this dramatic decline relative to nondefense R&D, the
absolute level of defense R&D in 2000 still exceeded that in
any year from 1953 to 1982, after adjusting for inflation. In 2000,
defense-related R&D as a share of U.S. R&D began to grow
again, subsequently reaching 14.9 percent of the nation's total
R&D in 2002.
In 1980 the Federal budget authority for defense-related R&D
was roughly equal to that for nondefense R&D
(figure 4-9 ).
Although the amount of defense-related R&D has fluctuated based
on changing national security concerns over the past 20 years, nondefense
R&D has increased since 1983. For FY 2001 the budget authorities
for defense R&D and for nondefense R&D had nearly reached
parity at $45.7 and $41.0 billion, respectively. The terrorist attacks
of September 11, 2001, dramatically reversed this trend and in the
proposed FY 2004 budget, $66.8 billion is slated for defense-related
R&D and $51.2 billion is reserved for nondefense R&D. (See
sidebar, "Federal R&D for Countering Terrorism.")
These amounts reflect increases of 46.2 percent in defense-related
R&D and 24.7 percent in nondefense R&D over the FY 2001
levels.
Civilian-Related R&D
R&D accounts for 13.4 percent of the FY 2004 Federal nondefense
discretionary budget authority of $383.0 billion.
Although this is less than that reserved for defense activities—16.7
percent of the $399.2 billion discretionary budget authority in
FY 2004—over 90 percent of Federal basic research funding is for
nondefense functions, accounting for a large part of the budgets
of agencies with nondefense missions such as general science (NSF),
health (NIH), and space research and technology [National Aeronautics
and Space Administration (NASA)] table
4-11 ,
appendix table
4-29 ).
Because many different agencies can support R&D programs with
the same basic objective, it is useful to aggregate Federal R&D
into budget functions to assess broad trends in national R&D
priorities.
Space-related R&D as a percentage of total R&D reached
a peak of 20.8 percent in 1965, during the height of the nation's
efforts to surpass the Soviet Union in space exploration (figure
4-8 ).
In terms of the nation's R&D performance, space-related R&D
accounted for an estimated 2.5 percent of total R&D in 2002.
The loss of the Space Shuttle Columbia and its crew of seven on
February 1, 2003, has resulted in uncertainty as to the future focus
and intensity of manned missions in the U.S. space-related R&D
effort. In the President's FY 2004 budget, crafted before the disaster,
55.2 percent of NASA's $15.5 billion discretionary budget was reserved
for R&D.
The most dramatic change in national R&D priorities over the
past 20 years has been the growing importance of health-related
R&D. As illustrated in figure
4-9 ,
health-related R&D rose from representing roughly a fourth (27.6
percent) of the Federal nondefense R&D budget allocation in
FY 1982 to more than half (54.5 percent) by FY 2003. Most of this
growth occurred after 1998 when NIH's budget was set on a pace to
double by 2003 (Meeks 2002).
In contrast to the steep growth in health-related R&D, the
budget allocation for general science R&D has grown relatively
little in the past 20 years. In fact, the growth in general science
R&D (figure 4-9 )
is more the result of a reclassification of several DOE programs
from energy to general science in FY 1998 than the result of increased
budget allocations. The formation of the Department of Homeland
Security (DHS) and the coincident reclassification of much of its
formerly civilian R&D activities as defense R&D is a more
recent example of how R&D budget function classifications can
change when the mission or focus of funding agencies changes.
The Federal S&T Budget
In recent years, alternative concepts have been used to isolate
and describe fractions of Federal support that could be associated
with scientific achievement and technological progress. In a 1995
report, a National Academy of Sciences (NAS) committee proposed
an alternative method of measuring the Federal Government's S&T
investment (NAS 1995). According to
the committee members this approach, called the Federal science
and technology (FS&T) budget, might provide a better way to
track and evaluate trends in public investment in R&D. The FS&T
concept differed from Federal funds for research in that it did
not include major systems development supported by DOD and DOE,
and it contained not only research but also some development and
some R&D plant.
Beginning with the FY 2000 budget, the Office of Management and
Budget (OMB) has presented its concept for an FS&T budget (figure
4-11 ).
Whereas the NAS FS&T compilation included only R&D, OMB's
FS&T budget was constructed of easily tracked programs and included
some non-R&D programs, such as NSF education programs and staff
salaries at NIH and NSF.
In the 2004 Budget of the United States, OMB's FS&T budget
is less than half of total Federal spending on R&D because it
excludes funding for defense development, testing, and evaluation.
It includes nearly all budgeted Federal support for basic research
in FY 2004, more than 80 percent of federally supported applied
research, and about half of federally supported nondefense development
(U.S. OMB 2003b).
As shown in figure 4-12
,
Federal R&D in the 2004 budget proposal, which includes expenditures
on facilities and equipment, would reach a level of $123 billion.
Of this amount, $54 billion would be devoted to basic and applied
research alone. The FS&T budget would reach $59 billion and
would include most of the research budget. However, differences
in the definition of research and FS&T imply that not all research
would be included in FS&T and vice versa. Moreover, a small
proportion (10 percent) of FS&T funds would fall outside the
category of Federal R&D spending.
R&D by Federal Agency
The Federal agencies with the largest R&D expenditures vary
considerably in terms of how their R&D budgets are spent.
Agency-reported data reveal remarkable diversity in terms of the
character of the R&D, who performs the R&D, and how R&D
is allocated to performers. These differences reflect the diverse
missions, histories, and cultures of the agencies.
Department of Defense
According to preliminary data provided by the DOD before budget
developments brought about by the war in Iraq, DOD will obligate
$45.0 billion, more than any other Federal agency, for R&D support
in FY 2003. DOD's support represents 45.6 percent of all Federal
R&D obligations (table
4-10 ). More than 85 percent of these funds ($38.5 billion) will
be spent on development, with $33.0 billion slated for major systems
development.
Industrial firms are expected to perform 65 percent of DOD-funded
R&D in FY 2003. These firms will account for an even greater
share of development funds (71 percent). DOD's R&D obligations
will constitute more than 80 percent of all Federal R&D obligations
to industry in FY 2003. Of DOD-funded R&D not performed by industry,
government laboratories and FFRDCs are expected to perform 85 percent
($13.3 billion). According to OMB, 63 percent of DOD's basic and
applied research funding was allocated using a fully competitive
merit review process in 2002.
Department of Health and Human Services
HHS, the primary source of Federal health-related R&D funding
(largely through NIH), will obligate the second largest amount for
R&D in FY 2003 at $27.6 billion, most of which ($14.5 billion)
will be for basic research. In FY 2003, HHS is expected to provide
universities and colleges, the primary recipients of HHS funding,
with $15.5 billion, or 67.4 percent of all Federal R&D funds
obligated to universities and colleges (table
4-12 ).
HHS will provide 75.6 percent ($4.7 billion) of all Federal R&D
funds obligated to nonprofit institutions, with most of these funds
going to such large research hospitals as Massachusetts General
Hospital and the Dana-Farber Cancer Institute (NSF/SRS
2002). In 2002, fully competitive merit review processes were
used to allocate 81 percent of HHS's basic and applied research
funding.
National Aeronautics and Space Administration
The third largest agency in terms of R&D support is NASA, with
R&D obligations expected to total $8.6 billion in FY 2003; 28.6
percent ($2.5 billion) will be earmarked for basic research. Although
not defense related, much of the development work sponsored by NASA
relies on industrial performers similar to those funded by DOD.
NASA is the second largest source of industrial R&D funds, an
expected $3.6 billion in FY 2003. Roughly 82 percent of NASA-funded
R&D is performed either by industrial firms or in Federal labs
or FFRDCs. Academic and nonprofit institutions perform the remainder.
In 2002, 85 percent of NASA's basic and applied research funding
was allocated using a fully competitive merit review process.
Department of Energy
Of the large R&D-funding agencies, DOE relies the most on the
R&D capabilities of FFRDCs, obligating 61.1 percent of its estimated
$7.5 billion in FY 2003 R&D funding to FFRDCs. DOE is the largest
funding source of the 36 FFRDCs, accounting for 61.2 percent of
all Federal R&D obligations to FFRDCs in FY 2003. DOE's high
reliance on its intramural laboratories and FFRDCs explains why
the share of its research funding that was allocated using a fully
competitive merit review process in 2002 was relatively low at 23
percent.
National Science Foundation
NSF is the Federal Government's primary source of funding for general
S&E R&D and is expected to fund $3.4 billion in R&D
in FY 2003. Of these funds, 94.2 percent are for basic research.
NSF is the second largest Federal source of R&D funds to universities
and colleges and is expected to provide $2.8 billion to academic
researchers in FY 2003. In 2002, 95 percent of NSF's basic and applied
research funding was allocated using a fully competitive merit review
process.
Other Agencies
DOD, HHS, NASA, DOE, and NSF are expected to account for 93.4 percent
of all Federal R&D obligations in FY 2003, with 93.9 percent
for basic research, 85.6 percent for applied research, and 97.8
percent for development. Unlike those Federal agencies, the Department
of Agriculture (USDA), DOC, and Department of the Interior (DOI)
obligate most of their R&D funds to mission-oriented R&D
conducted in their own laboratories, which are run by the Agricultural
Research Service, the National Institute for Standards and Technology
(NIST), and the U.S. Geological Survey, respectively.
Federal R&D Funding by Performer and Field
of Science or Engineering
Federal Funding to Academia
The Federal Government has long provided the largest share of R&D
funds used by universities and colleges. In the early 1980s, Federal
funds accounted for roughly two-thirds of the academic total. That
share dropped to 57.7 percent in 2000 but is expected to rise to
58.5 percent in 2002. Although this share of funding has not changed
much in recent years, the actual amount of funding in real terms
increased on average 5.1 percent per year between 1985 and 1994,
3.4 percent per year between 1994 and 2000, and 7.3 percent per
year between 2000 and 2002. For more information on academic R&D,
see chapter 5.
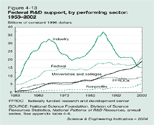
Federal Funding to Industry
The greatest fluctuation in Federal support as reported by R&D
performers occurred in obligations to industry, ranging from a low
of $10.4 billion (constant 1996 dollars) in 1955 (when the NSF time
series began) to a high of $37.1 billion in 1987 (figure
4-13 ).
Between 1998 and 2002 Federal funds for industrial R&D activities
declined an annual average of 7.8 percent in real terms. Overall
the Federal share of industry's performance has been steadily declining
since its peak of 56.7 percent in 1959. Beginning in 1989, the amount
of federally funded R&D reported by industry began to diverge
from the amount reported by the Federal Government. For details
on this discrepancy, see sidebar, "Tracking R&D:
Gap Between Performer- and Source-Reported Expenditures.''
The industries that report the greatest amount of Federal R&D
funding include the computer and electronic products industry; the
professional, scientific, and technical services industry; and the
aerospace industry. Companies in these three industries accounted
for 87 percent of all federally funded industrial R&D reported
in 2001. In contrast, this same group accounted for only 37 percent
of all company-financed R&D in 2001. Approximately half of the
$7.9 billion of R&D performed by companies classified in the
aerospace industry came from Federal sources in 2001. In comparison,
companies classified in the pharmaceuticals and medicines industry
reported no federally funded research in 2001.
Federal Research Funding by Field
According to preliminary estimates, Federal obligations for research
alone (excluding development) will total $53.4 billion in FY 2003.
Life sciences will receive the largest portion of this funding (53.7
percent, or $28.7 billion), most of which will be provided by HHS,
followed by engineering (17.2 percent), physical sciences (9.7 percent),
environmental sciences (7.3 percent), and mathematics and computer
sciences (5.4 percent) (figure
4-14 ).
Social sciences, psychology, and all other sciences will account
for another 2.0, 1.8, and 3.0 percent, respectively.
HHS, primarily through NIH, will provide the largest share (50.2
percent) of all Federal research obligations in FY 2003. The next
largest contributor will be DOD (12.2 percent), providing substantial
funding for research in engineering ($3.3 billion) and in mathematics
and computer sciences ($1.1 billion). NASA will provide 10.8 percent,
primarily in the fields of engineering, environmental sciences,
and physical sciences. DOE will provide 10.1 percent, primarily
in the fields of physical sciences and engineering. NSF will provide
6.4 percent, contributing between $0.5 and $0.6 billion to each
of the following fields: physical sciences, mathematics and computer
sciences, engineering, environmental sciences, and life sciences.
Federal obligations for research have grown at different rates
for different S&E fields, reflecting changes in perceived public
needs in those fields, changes in the national resources (e.g.,
scientists, equipment, and facilities) that have been built up in
those fields over time, as well as differences in scientific opportunities
across fields (appendix
table 4-34 ).
Based on preliminary estimates for FY 2003, the major field of mathematics
and computer sciences has experienced the highest rate of growth
in Federal obligations for research, which was 7.8 percent per year
in real terms between 1982 and 2003. Life sciences had the second
highest rate (6.2 percent), followed by psychology (4.6 percent);
environmental sciences (3.3 percent); social sciences, including
anthropology, economics, political sciences, sociology, and other
areas (2.3 percent); engineering (2.2 percent); and physical sciences
(1.0 percent).
The trends in Federal support for these broad fields of research,
however, may not reflect trends for the smaller fields that they
contain. For example, within the broad field of mathematics and
computer sciences, Federal support for research in mathematics grew
3.3 percent per year in real terms between FY 1982 and FY 2001,
whereas support for research in computer sciences grew 10.9 percent.
Within life sciences during the same period, support for biological
and agricultural research grew 6.0 percent, compared with research
support for medical sciences, which grew 4.3 percent. Within the
physical sciences, support for astronomy grew 2.7 percent, whereas
support for physics declined 0.5 percent.
Caution should be employed when examining these trends in Federal
support for detailed S&E fields because Federal agencies classify
a significant amount of R&D only by major S&E field such
as life sciences, physical sciences, or social sciences. In FY 2001,
for example, 16.6 percent of the Federal research obligations classified
by major S&E field were not subdivided into detailed fields.
This was less pronounced in physical sciences and in mathematics
and computer sciences, in which all but 7.6 percent of the research
dollars were subdivided. It was most pronounced in engineering and
social sciences, in which 27.3 and 63.9 percent, respectively, of
the research obligations were not subdivided into detailed fields.
Federal R&D Tax Credit
The traditional justification for tax incentives for research activities
is that results from these activities, especially more basic or
long-term research, are often hard to capture privately because
others might benefit directly or indirectly from them. Therefore,
businesses might engage in levels of research below those that would
be beneficial to the nation as a whole. In this regard, direct funding
and tax incentives are complementary fiscal tools. Tax incentives
are thought to stimulate R&D activity generally across industries
and technologies (Tassey
1996), whereas direct funding through government agencies (as
well as certain industry-relevant academic research) stimulates
R&D in targeted fields (e.g., health, energy, or defense) or
by certain performers [e.g., Small Business Innovation Research
Program (SBIR)].
The Federal research and experimentation (R&E) tax credit was
first established on a temporary basis in 1981 and has been renewed
several times since.
It was last reinstated by the Tax Relief Extension Act of 1999 through
June 30, 2004. The Bush administration and several congressional
bills pending, as of this writing, propose to make the R&E credit
permanent (Knezo 2002).
Several studies based on U.S. data from the late 1990s have concluded
that a dollar in tax credit likely stimulates, on average, a dollar
of additional R&D on a long-term basis, as well as smaller short-term
effects (Bloom, Griffith, and Van Reenen
2002; and Hall and Van Reenen 2000).
However, the studies caution that administrative costs are often
ignored in most empirical studies. In addition, for a more complete
assessment of this policy instrument, interactions with other components
of corporate taxes and tradeoffs with other policies need to be
integrated into purely cost-benefit analyses.
Structure of the Credit and Tax Data
A regular credit is provided for 20 percent of qualified research
above a base amount based on the ratio of research expenses to gross
receipts for 1984–88. Startup or younger companies follow different
formulas. An alternative R&E credit is available for corporate
fiscal years that began after June 30, 1996.
Both the regular and the alternative R&E credits include provisions
for basic research payments paid to qualified universities or scientific
research organizations above a certain base-period amount.
In 1999 (the latest year for which data are available), approximately
10,000 companies claimed $5.281 billion in R&E credits, about
the same level as in 1998 (table
4-13 ).
However, not all R&E claims are allowed because there is a limitation
on the reduction of a company's total tax liability. In 1999, 267
companies claimed $540 million for basic research, about 10 percent
of the total R&E credit. The 1999 basic research credits were
36 percent larger than those in 1998, but the number of claims declined
by half.
Federal Budget Impact
R&E credits are tax expenditures or government revenue losses
because of preferential provisions. Tax expenditures from corporate
income taxes relate mostly to cost recovery for certain investments,
including research activities. Out-lay-equivalent is one
of three accounting methods used to estimate these tax expenditures.
This method converts R&E credits into data comparable to Federal
R&D outlays.
According to this measure, tax credit claims in 1999 were equivalent
to outlays of $2.625 billion, or 3.5 percent of direct Federal R&D
outlays in 1999 (U.S. OMB 2000) (appendix
table 4-35 ).
Although R&E claims data for tax year 2000 are not available,
the credit generated an estimated outlay equivalent of $2.510 billion,
or 3.4 percent of Federal R&D outlays in 2000 (U.S.
OMB 2001).

|