About the Assessment: Overview
Part I of the 2007 National Indian Education Study (NIES) presents the performance results of American Indian and Alaska Native (AI/AN) students at grades 4 and 8 on the National Assessment of Educational Progress (NAEP) in reading and mathematics. The first NIES study was conducted in 2005, and the results for 2007 are compared to results from that assessment. The Technical Review Panel, whose members included American Indian and Alaska Native educators and researchers from across the country, was assembled to advise the study and oversee the development of survey questionnaires.
Approximately 10,100 AI/AN students participated in the 2007 NAEP reading assessment nationwide, and about 10,300 AI/AN students participated in the 2007 mathematics assessment. The national results reflect the performance of students enrolled in public, Bureau of Indian Education (BIE), Department of Defense, and private schools. The percentage of sampled AI/AN students enrolled in schools other than public and BIE schools nationally was approximately 5 percent. View the 2007 NIES participation tables.
In addition to the national sample, the NIES focused on 11 states with relatively large populations of American Indian and Alaska Native students: Alaska, Arizona, Minnesota, Montana, New Mexico, North Carolina, North Dakota, Oklahoma, Oregon, South Dakota, and Washington. The AI/AN student enrollment in these states represents more than 50 percent of the AI/AN student enrollment in the nation. In 2005, the NIES focused on 7 states: Alaska, Arizona, Montana, New Mexico, North Dakota, Oklahoma, and South Dakota.
NIES state-level data include results from AI/AN students who attended public and Bureau of Indian Education (BIE) schools. The national results used for comparison to these state results also reflect the performance of public and BIE school students only.
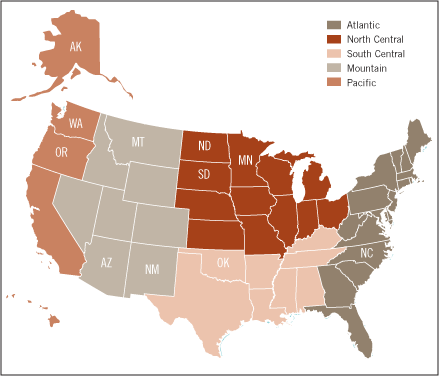
Results for American Indian/Alaska Native students are also presented for five NIES-defined regions of the country: Atlantic, North Central, South Central, Mountain, and Pacific. These regions, which differ from those used in other NAEP reports, are based on U.S. Census divisions and are configured to align with the overall distribution of the AI/AN student population. The regional results are based on samples from students enrolled in all types of schools (public, private, BIE, and Department of Defense) and reflect the combined samples from all of the states within each region.
Results are reported by school density, which refers to the proportion of AI/AN students enrolled in a given school. Low density schools have less than 25 percent AI/AN students enrolled, while in high density schools at least 25 percent of the students are AI/AN. High density schools were oversampled for NIES 2007 to support the reporting of results based on school density.
Map of regions and selected states for the National Indian Education Study: 2007
Find out more about the NIES Sample Design and Weighting.
|

