|
|
||||||||||||||||||||||||||||||||||||||||||||||||||||||||||||
|
Emissions of Greenhouse Gases Report
|
Full Printer-Friendly Version Signup for email updates |
|||||||||||||||||||||||||||||||||||||||||||||||||||||||||||
|
|
| |||||||||||||||||||||||||||||||||||||||||||||||||||||||||||
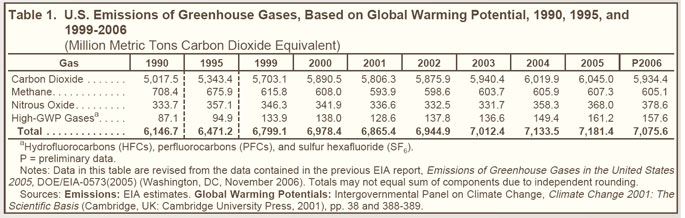
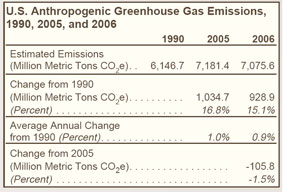
| Total Emissions | ||||||||||||||||||||||||||||||||||||||||||||||||||||||||||||
|---|---|---|---|---|---|---|---|---|---|---|---|---|---|---|---|---|---|---|---|---|---|---|---|---|---|---|---|---|---|---|---|---|---|---|---|---|---|---|---|---|---|---|---|---|---|---|---|---|---|---|---|---|---|---|---|---|---|---|---|---|
 |
  |
|||||||||||||||||||||||||||||||||||||||||||||||||||||||||||
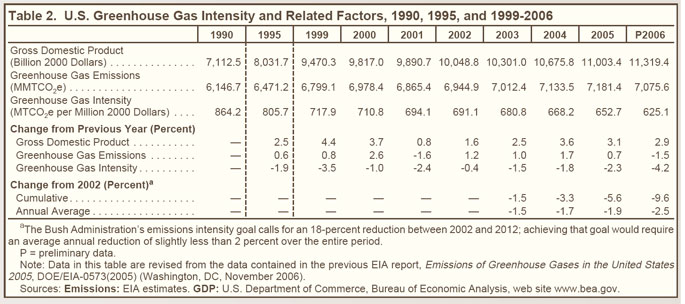
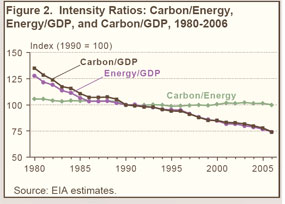
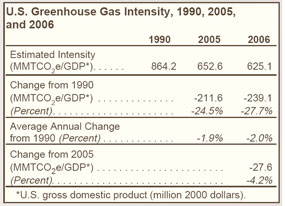
| Greenhouse Gas Intensity | ||||||||||||||||||||||||||||||||||||||||||||||||||||||||||||
|
  |
|||||||||||||||||||||||||||||||||||||||||||||||||||||||||||
| Greenhouse Gas Emissions in the U.S. Economy | ||||||||||||||||||||||||||||||||||||||||||||||||||||||||||||
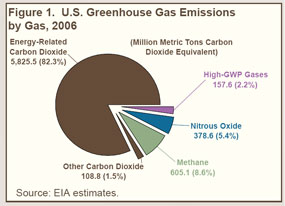
The diagram on right illustrates the flow of U.S. greenhouse gas emissions in 2006, from their sources to their distribution across the U.S. end-use sectors. The left side shows CO2 by fuel sources and quantities and other gases by quantities; the right side shows their distribution by sector. The center of the diagram indicates the split between CO2 emissions from direct fuel combustion and electricity conversion. Adjustments indicated at the top of the diagram for U.S. territories and international bunker fuels correspond to greenhouse gas reporting requirements developed by the United Nations Framework Convention on Climate Change (UNFCCC). CO2. CO2 emission sources include energy-related emissions (primarily from fossil fuel combustion) and emissions from industrial processes. The energy subtotal (5,890 MMTCO2e) includes petroleum, coal, and natural gas consumption and smaller amounts from renewable sources, including municipal solid waste and geothermal power generation. The energy subtotal also includes emissions from nonfuel uses of fossil fuels, mainly as inputs to other products. Industrial process emissions (109 MMTCO2e) include cement manufacture, limestone and dolomite calcination, soda ash manufacture and consumption, carbon dioxide manufacture, and aluminum production. The sum of the energy subtotal and industrial processes equals unadjusted CO2 emissions (5,999 MMTCO2e). The energy component of unadjusted emissions can be divided into direct fuel use (3,546 MMTCO2e) and fuel converted to electricity (2,344 MMTCO2e). Non-CO2 Gases. Methane (605 MMTCO2e) and nitrous oxide (379 MMTCO2e) sources include emissions related to energy, agriculture, waste management, and industrial processes. Other, high-GWP gases (158 MMTCO2e) include hydrofluorocarbons (HFCs), perfluorocarbons (PFCs), and sulfur hexafluoride (SF6). These gases have a variety of uses in the U.S. economy, including refrigerants, insulators, solvents, and aerosols; as etching, cleaning, and firefighting agents; and as cover gases in various manufacturing processes. Adjustments. In keeping with the UNFCCC, CO2 emissions from U.S. Territories (61 MMTCO2e) are added to the U.S. total, and CO2 emissions from fuels used for international transport (both oceangoing vessels and airplanes) (126 MMTCO2e) are subtracted to derive total U.S. greenhouse gas emissions (7,076 MMTCO2e). Emissions by End-Use Sector. CO2 emissions by end-use sectors are based on EIA’s estimates of energy consumption (direct fuel use and purchased electricity) by sector and on the attribution of industrial process emissions by sector. CO2 emissions from purchased electricity are allocated to the end-use sectors based on their shares of total electricity sales. Non-CO2 gases are allocated by direct emissions in those sectors plus emissions in the electric power sector that can be attributed to the end-use sectors based on electricity sales. Residential emissions (1,234 MMTCO2e) include energy-related CO2 emissions (1,217 MMTCO2e); and non-CO2 emissions (17 MMTCO2e). The non-CO2 sources include direct methane and nitrous oxide emissions from direct fuel use. Non-CO2 indirect emissions attributable to purchased electricity, including methane and nitrous oxide emissions from electric power generation and SF6 emissions related to electricity transmission and distribution, are also included. Emissions in the commercial sector (1,287 MMTCO2e) include both energy-related CO2 emissions (1,056 MMTCO2e) and non-CO2 emissions (231 MMTCO2e). The non-CO2 emissions include direct emissions from landfills, wastewater treatment plants, commercial refrigerants, and stationary combustion emissions of methane and nitrous oxide. Non-CO2 indirect emissions attributable to purchased electricity, including methane and nitrous oxide emissions from electric power generation and SF6 emissions related to electricity transmission and distribution, are also included. Industrial emissions (2,544 MMTCO2e) include CO2 emissions (1,777 MMTCO2e)—which can be broken down between combustion (1,668 MMTCO2e) and process emissions (109 MMTCO2e)—and non-CO2 emissions (767 MMTCO2e). The non-CO2 direct emissions include emissions from agriculture (methane and nitrous oxide), coal mines (methane), petroleum and natural gas pipelines (methane), industrial process emissions (methane, nitrous oxide, HFCs, PFCs and SF6), and direct stationary combustion emissions of methane and nitrous oxide. Non-CO2 indirect emissions attributable to purchased electricity, including methane and nitrous oxide emissions from electric power generation and SF6 emissions related to electricity transmission and distribution, are also included. Transportation emissions (2,010 MMTCO2e) include energy-related CO2 emissions from mobile source combustion (1,885 MMTCO2e); and non-CO2 emissions (126 MMTCO2e). The non-CO2 emissions include methane and nitrous oxide emissions from mobile source combustion and HFC emissions from the use of refrigerants for mobile source air-conditioning units. 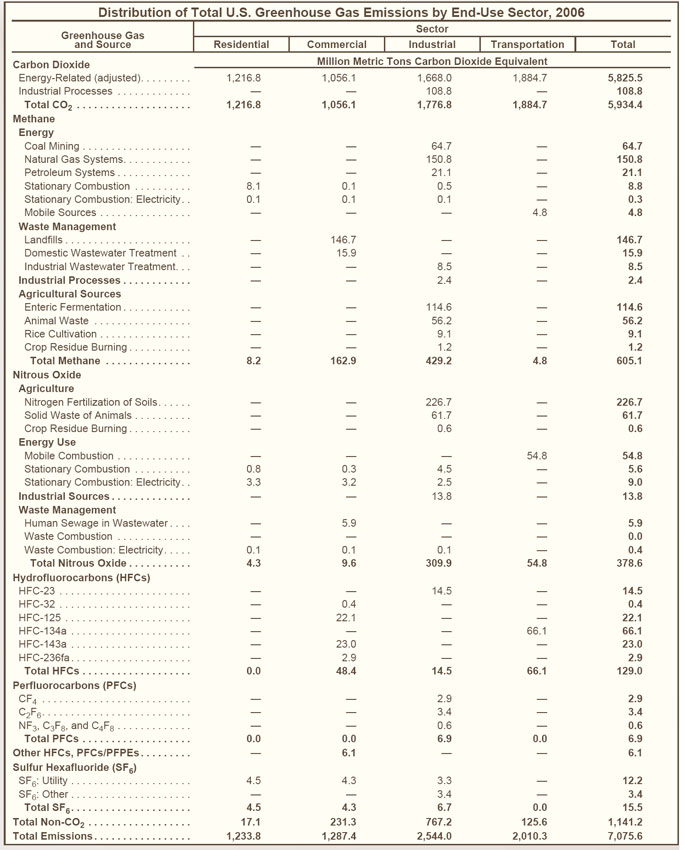
|
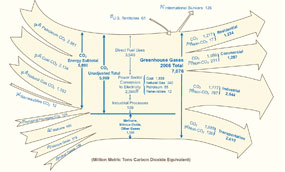 Click Chart to Enlarge |
|||||||||||||||||||||||||||||||||||||||||||||||||||||||||||
| U.S. Emissions in a Global Perspective | ||||||||||||||||||||||||||||||||||||||||||||||||||||||||||||
 No data for all years |
   |
|||||||||||||||||||||||||||||||||||||||||||||||||||||||||||
| Recent U.S. and International Developments in Global Climate Change | ||||||||||||||||||||||||||||||||||||||||||||||||||||||||||||
United States
International: United Nations Framework Convention on Climate Change and the Kyoto Protocol
|
||||||||||||||||||||||||||||||||||||||||||||||||||||||||||||
| Units for Measuring Greenhouse Gases | ||||||||||||||||||||||||||||||||||||||||||||||||||||||||||||
Emissions data are reported here in metric units, as favored by the international scientific community. Metric tons are relatively intuitive for users of English measurement units, because 1 metric ton is only about 10 percent heavier than 1 English short ton. Throughout this report, emissions of carbon dioxide and other greenhouse gases are given in carbon dioxide equivalents. In the case of carbon dioxide, emissions denominated in the molecular weight of the gas or in carbon dioxide equivalents are the same. Carbon dioxide equivalent data can be converted to carbon equivalents by multiplying by 12/44. Emissions of other greenhouse gases (such as methane) can also be measured in carbon dioxide equivalent units by multiplying their emissions (in metric tons) by their global warming potentials (GWPs). Carbon dioxide equivalents are the amount of carbon dioxide by weight emitted into the atmosphere that would produce the same estimated radiative forcing as a given weight of another radiatively active gas. Carbon dioxide equivalents are computed by multiplying the weight of the gas being measured (for example, methane) by its estimated GWP (which is 23 for methane). In 2001, the Intergovernmental Panel on Climate Change (IPCC) Working Group I released its Third Assessment Report, Climate Change 2001: The Scientific Basis.16 Among other things, the Third Assessment Report updated a number of the GWP estimates that appeared in the IPCC’s Second Assessment Report.17 The GWPs published in the Third Assessment Report were used for the calculation of carbon dioxide equivalent emissions for this report. Generally, the level of total U.S. carbon dioxide equivalent emissions is 0.6 percent higher when the GWPs from the Third Assessment Report are used; however, the trends in growth of greenhouse gas emissions are similar for the two sets of GWP values. GWPs from the Second Assessment Report still are used for comparisons among countries. |
||||||||||||||||||||||||||||||||||||||||||||||||||||||||||||
|
||||||||||||||||||||||||||||||||||||||||||||||||||||||||||||