|
|
|
|
|
|
|
|
 |
USAID Information:
External Links:
|
|
|
|
|
|
|
|
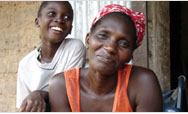
South Africa
The Challenge
South Africa is an emerging market and regional powerhouse with abundant natural resources and well-developed financial, legal, energy, and transport
sectors. Despite 11 years of democracy and 28 successive quarters of economic growth, deep economic and social fissures from the apartheid era
persist. USAlD uses technical assistance, training and innovative partnerships to address South Africa's key constraints of high unemployment, uneven
access to services, high crime rates and HIVIAIDS.
Objectives, Sectors and Workforce
  Definitions of Information Contained in the Country Profile Tables
Please note: All linked documents below are in PDF format
| Program Budget (Appropriations by Objective) |
FY 2004 ($000) |
FY 2005 ($000) |
FY 2006 ($000) |
FY 2007 ($000) |
Percent Change FY 04-07 |
2005 SO Performance Score |
Direct SO Admin. Cost Ratio |
| 674-001 Democracy and Governance |
5,316 |
6,218 |
6,960 |
0 |
N/A |
|
|
0.25 |
| 674-002 Education |
9,376 |
6,248 |
8,459 |
0 |
N/A |
1.19 |
Exceeded |
0.24 |
| 674-004 Economic Capacity Building |
3,728 |
2,400 |
2,760 |
0 |
N/A |
1.15 |
Exceeded |
0.18 |
| 674-006 Housing & Municipal Services |
6,041 |
5,233 |
3,247 |
0 |
N/A |
1.00 |
Met |
0.27 |
| 674-008 HIV/AIDS and Primary Health Care |
44,190 |
78,638 |
105,750 |
0 |
N/A |
2.00 |
Exceeded |
0.05 |
| 674-009 Employment Creation |
6,925 |
6,603 |
5,933 |
0 |
N/A |
1.49 |
Exceeded |
0.15 |
| 674-VVV Service Delivery |
0 |
0 |
0 |
9,858 |
N/A |
N/A |
|
N/A |
| 674-WWW Health and HIV and AIDS |
0 |
0 |
0 |
107,520 |
N/A |
N/A |
|
N/A |
| 674-YYY Education |
0 |
0 |
0 |
2,560 |
N/A |
N/A |
|
N/A |
| 674-ZZZ Employment |
0 |
0 |
0 |
8,161 |
N/A |
N/A |
|
N/A |
| Country Total |
75,576 |
105,340 |
133,109 |
128,099 |
69.5% |
|
|
|
|
Mission Director: Carleene Dei
MCA Status: Not a Candidate
PEPFAR Focus Country: Yes
Provided or Received Services From Other Missions: Provided
| Program Budget (Appropriations by Account) |
FY 2004 ($000) |
FY 2005 ($000) |
FY 2006 ($000) |
FY 2007 ($000) |
Percent Change FY 04-07 |
| Child Survival and Health Programs Fund |
31,028 |
5,328 |
5,070 |
5,130 |
-83.5% |
| Development Assistance |
29,398 |
25,710 |
24,362 |
19,279 |
-34.4% |
| Economic Support Fund |
1,988 |
992 |
1,287 |
1,300 |
-34.6% |
| Global HIV/AIDS Initiative |
13,162 |
73,310 |
102,390 |
102,390 |
677.9% |
| Total |
75,576 |
105,340 |
133,109 |
128,099 |
69.5% |
| Program Budget by Sector and Account |
FY 2004 ($000) |
FY 2005 ($000) |
FY 2006 ($000) |
FY 2007 ($000) |
Percent Change FY 04-07 |
| Basic Education |
DA |
6,773 |
5,421 |
7,909 |
2,560 |
-62.2% |
|
ESF |
210 |
0 |
0 |
0 |
N/A |
| Agriculture and Environment |
DA |
9,937 |
7,510 |
6,097 |
6,192 |
-37.7% |
|
ESF |
85 |
0 |
0 |
0 |
N/A |
| Higher Education & Training |
DA |
2,891 |
1,227 |
0 |
0 |
N/A |
| Economic Growth |
DA |
5,884 |
6,326 |
5,183 |
5,271 |
-10.4% |
|
ESF |
398 |
0 |
0 |
0 |
N/A |
| Democracy and Governance |
DA |
3,913 |
5,226 |
5,173 |
5,256 |
34.3% |
|
ESF |
1,295 |
992 |
1,287 |
1,300 |
0.4% |
| Family Planning / Reproductive Health |
CSH |
1,328 |
1,328 |
1,313 |
1,130 |
-14.9% |
| HIV / AIDS |
CSH |
25,700 |
0 |
0 |
0 |
N/A |
|
GHAI |
13,162 |
73,310 |
102,390 |
102,390 |
677.9% |
| Child Survival and Maternal Health |
CSH |
2,000 |
2,000 |
1,780 |
2,000 |
0.0% |
| Other Infectious Diseases |
CSH |
2,000 |
2,000 |
1,977 |
2,000 |
0.0% |
| Total |
75,576 |
105,340 |
133,109 |
128,099 |
69.5% |
| Workforce |
FY 2004 |
FY 2005 |
FY 2006 |
FY 2007 |
Percent Change FY 04-07 |
| US Direct Hires |
12 |
18 |
25 |
22 |
83.3% |
| US Non Direct Hires |
12 |
15 |
17 |
17 |
41.7% |
| Foreign Nationals |
79 |
81 |
91 |
91 |
15.2% |
| Total |
103 |
114 |
133 |
130 |
26.2% |
| Operating Expense |
FY 2004 ($000) |
FY 2005 ($000) |
FY 2006 ($000) |
FY 2007 ($000) |
Percent Change FY 04-07 |
| Salaries and benefits |
2,425 |
2,381 |
2,596 |
2,597 |
7.1% |
| Travel |
655 |
569 |
487 |
487 |
-25.6% |
| Transportation of things |
199 |
110 |
118 |
118 |
-40.7% |
| Rent |
562 |
749 |
669 |
669 |
19.0% |
| Security |
242 |
331 |
334 |
334 |
38.0% |
| Equipment |
353 |
444 |
117 |
117 |
-66.9% |
| ICASS - Operating Expense only |
407 |
285 |
290 |
290 |
-28.7% |
| Other Operating Expense |
546 |
787 |
-6 |
-6 |
-101.1% |
| Total OE Budget |
5,389 |
5,656 |
4,605 |
4,606 |
-14.5% |
| Total OE Budget |
10,778 |
11,312 |
9,210 |
9,212 |
-14.5% |
| US direct hire salary and benefits |
2,371 |
2,194 |
2,418 |
2,314 |
-2.4% |
| Program Funded Administrative Expenses |
|
|
|
6,180 |
|
| Country Total Administrative Budget |
|
|
|
13,100 |
|
| Percent of Bureau OE Total |
|
|
|
6.0% |
|
| Mission Summary |
FY 2004 |
FY 2005 |
FY 2006 |
FY 2007 |
| Program per US Direct Hire ($000) |
6,298 |
5,852 |
5,324 |
5,823 |
| Program per All US ($000) |
3,149 |
3,192 |
3,169 |
3,285 |
| Program per Position ($000) |
734 |
924 |
1,001 |
985 |
|
|
|
|
|
|
| Operating Expense as % of Program Funding |
|
|
|
3.6% |
| Program Funded Admin Expense as % of Total Admin |
|
|
|
47.2% |
| Total Admin Expense as % of Program Funding |
|
|
|
10.2% |
Other Major Donors:
Bilateral: United Kingdom, Germany, Norway, Japan.
Multilateral: The United Nations agencies, the European Union, the World Bank, the International Monetary Fund, the African Development Bank.
Back to Top ^
|