|
 |
| About This Page |
| The National Weather Service modernized in the
1990s, with great technological advances. To see some of the new technology, look below. |
|
|
 |
WSR-88D |
 |
| Radar capabilities have vastly improved with the addition of the WSR-88D (Weather
Surveillance Radar - 88Doppler). Besides showing where storms are, the 88D can help forecasters monitor threats such
as tornadoes, large hail and flash flooding. |
 |
The National Weather Service in Little Rock
received its 88D in January, 1993. Since then, there has been plenty of severe
weather...and a lot of warnings issued. So how does the 88D work? |
 |
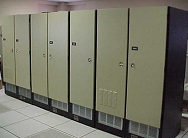
| The Radar Data
Acquisition Unit, or RDA (pictured above and to right), scans
the atmosphere for storms at several elevations (blue lines to right). Data is then
sent to the RPG (Radar Product Generator). |
| The RPG then runs the data through several
mathematical algorithms so that images may be generated for forecasters to analyze. |
 |
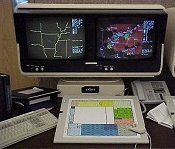 |
The images are viewed at the Principle
User Processor, or PUP. Now
forecasters can determine if a warning is necessary. What are the forecasters
looking at? |
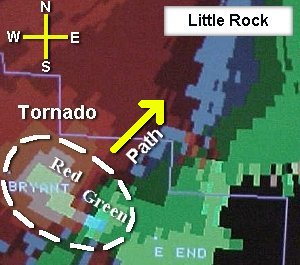 |
| In the picture: A
tornadic signature was seen on radar to the southwest of Little Rock around 625 pm CST on
01/21/99. Twenty minutes later, the tornado swept through the downtown
area. |
|
Velocity images (such as the one shown above) are
perhaps the most valuable products generated by the 88D. Forecasters look for green
or blue colors (wind toward the radar) adjacent to red or yellow colors (wind away from
the radar). Such a signature would indicate rotation and the possibility of a
tornado. |
| The 88D also generates a VIL (Vertically
Integrated Liquid) product which
is used to determine the threat of large hail. When moisture is deep (from the
ground into subfreezing air aloft), VIL values tend to go up. When VIL values become
excessively high... forecasters look for large hail (dime size or larger) to develop. |
 |
 |
The 88D can also determine how much rain has
fallen. This is valuable information, especially in data sparse areas where
observations are not available. Forecasters use this data to determine if flash
flooding will occur. |
| In the picture:
Excessive rain occurred from west central into north central Arkansas (north and west of
Little Rock) during the evening of 10/05/98 into the morning hours of 10/06/98. Five to
seven inches of rain was common (with locally more) from the Mena area northeast through
Clinton and Mountain View. |
| Because the 88D is relatively new, forecasters are
urged to study the data it produces to become better radar operators. Data from the
radar is saved for research purposes, and is viewed after severe weather episodes to see
where techniques worked well...and where techniques could have been improved. |
|