Climate Monitoring / Climate of 2002 / Annual / Help

National Oceanic and Atmospheric Administration
Climate of 2002
Annual Review

National Climatic Data Center
January 23, 2003
2002 Global Temperature Anomalieslarger image

page separator

Top of Page Global Temperatures

Global temperatures in 2002 were 0.56°C (1.01°F)* above the long-term (1880-2001) average**, which places 2002 as the second warmest year on record. The only warmer year was 1998 in which a strong El Niño contributed to higher global temperatures. Land temperatures were 0.87°C (1.57°F)* above average and ocean temperatures 0.42°C (0.76°F)* above the 1880-2001 mean. Both land and ocean temperature ranks as second warmest on record.
Global Blended Temperatures for 2002
larger image

The map of temperature anomalies (above right) contains data from an in-situ and satellite blended data set of land and ocean temperatures. The period of record for this data set is 1988 to the present, a relatively warm period compared to the base period used in the creation of the land only map of temperature anomalies below. Some minor differences result from the differences in base periods and data that are used to construct the two maps.

Neutral ENSO conditions at the beginning of 2002 gave way to a strengthening El Niño episode during late boreal summer and continuing into early winter. Moderate positive anomalies of equatorial Pacific sea surface temperatures (El Niño conditions) are expected to persist through the early part of 2003.

The Northern Hemisphere temperature averaged near record levels in 2002 at 0.63°C (1.13°F) above the long-term average. The Southern Hemisphere also reflected the globally warmer conditions, with a positive anomaly near 0.46°C (0.83°F).

Northern Hemisphere sea ice extent
larger image
In 2002, warmer temperatures and shifts in atmospheric circulation patterns contributed to the greatest surface melt on the Greenland Ice Sheet in the 24-year satellite record. There was also a record low level of Arctic sea ice extent in September, the lowest since satellite monitoring began in 1978, according to the National Snow and Ice Data Center.


Annual anomalies in excess of 1.0°C (1.8°F) were widespread across much of North America and Asia. Additional details on temperatures throughout the world are included below.

*Anomalies use most recent station data and NCEP OI Version 2.

**The 1880-2001 average combined land and ocean annual temperature is 13.9°C (56.9°F), the annually averaged land temperature for the same period is 8.5°C (47.3°F), and the long-term annually averaged sea surface temperature is 16.1°C (60.9°F).


Top of Page Temperature Trends

During the past century, global surface temperatures have increased at a rate near 0.6°C/century (1.1°F/century), but this trend has dramatically increased to a rate approaching 2.0°C/century (3.6°F/century) during the past 25 years. There have been two sustained periods of warming, one beginning around 1910 and ending around 1945, and the most recent beginning about 1976. Temperatures during the latter period of warming have increased at a rate comparable to the rates of warming projected to occur during the next century with continued increases of anthropogenic greenhouse gases (IPCC, 2001).

Data collected by NOAA's polar orbiting satellites and analyzed for NOAA by the University of Alabama in Huntsville (UAH) and Remote Sensing Systems (RSS, Santa Rosa, California) indicate that temperatures centered in the middle troposphere at altitudes from 2 to 6 miles made 2002 the second warmest year for the globe.

The average lower troposphere temperature (surface to about 5 miles) for 2002 was the second warmest on record. Analysis of the satellite record that began in 1979 shows that the global average temperature in the middle troposphere has increased, but the differing analysis techniques of the two teams result in different trends. The UAH team found an increase of 0.035°C/decade (0.06°F/decade) while a trend of 0.115°C/decade (0.21°F/decade) was found by the RSS team. This compares to surface temperature increases approaching 0.5°C (0.3°F/decade) during the same period.
MSU/Surface Temperatures
larger image

Global Stratospheric Temperatures
larger image
While lower tropospheric temperatures as measured by the MSU indicate increasing temperatures over the last 2 decades, stratospheric (14 to 22 km / 9 to 14 miles) temperatures have been decreasing. This is consistent with the depletion of ozone in the lower stratosphere. The large increase in 1982 was caused by the volcanic eruption of El Chichon, and the increase in 1991 was caused by the eruption of Mt. Pinatubo in the Philippines.

Top of Page Regional Temperatures

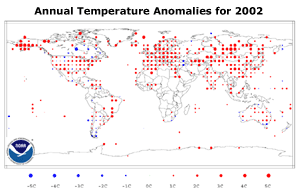
Global Temperature Anomalies
larger image
Global temperatures were above average during 2002 throughout most land areas. The adjacent figure depicts the warmer than average temperatures (for a 1961-1990 base period) that were widespread across much of the United States as well as most of Europe and Asia. Temperatures in these regions were 1-4°C (1.8-7.2°F) above the 1961-1990 average. This map was created using data from the Global Historical Climatology Network, a network of more than 7,000 land surface observing stations.The only widespread areas of negative anomalies were across parts of eastern Canada as well as southern Argentina where temperatures were between 1 and 3°C (1.8-5.4°F) cooler than average.

Notable temperature extremes during 2002 included a severe heatwave during May and June across southwest Asia. Daily maximum temperatures reached as high as 50°C (122°F) which resulted in over 1,000 deaths across India and Pakistan. A series of winter storms affected parts of Bolivia, Peru and Argentina during July and August, bringing heavy snowfall and cold temperatures that were responsible for nearly 60 deaths. Winter storms that affected southeastern Europe during January were accompanied by cold temperatures and local snow depths of over 1 meter (3.3 feet) in parts of Albania, Bulgaria and Greece.

Top of Page Global Precipitation

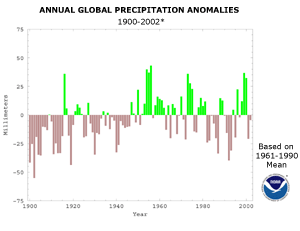
Global Precipitation Anomalies
larger image
Global precipitation was below the 1961-1990 average in 2002. Much of Australia experienced severe drought, with the eastern part of the country the worst affected. India monsoon rainfall was 19 percent below normal, with the resulting drought characterized as the worst since 1987. Other drought-affected areas included the western United States and portions of the north coast of China.

After a dry beginning to 2002, several typhoons brought excessive rains to parts of southeast Asia and Japan, the southeast coast of China, Taiwan and the Philippines. In contrast to drought conditions during the first half of 2002, the onset of monsoon rains in southeast Asia promoted extensive flooding along the Mekong Delta. Seasonal flooding in much of south Asia (Nepal, Bangladesh and northeastern India) during June-August claimed more than 1,000 lives. In the eastern United States, long-term drought was ameliorated by a turn to wetter weather, due in part to moisture from tropical systems.

Additional information on other notable weather events can be found in the Significant Events section of this report, or through the monthly Climate Perspectives reports.


Top of Page References

IPCC, 2001: Climate Change 2001: The Scientific Basis, Contribution of Working Group I to the Third Assessment Report of the Intergovernmental Panel of Climate Change. J.T. Houghton, Y. Ding, D.J. Griggs, M. Noguer, P.J. vander Linden, X.Dai, K. Maskell, and C.A. Johnson (Eds.), Cambridge University Press, 881 pp.

page separator

NOAA's National Climatic Data Center is the world's largest active archive of weather data. The preliminary temperature and precipitation rankings are available from the center by calling: 828-271-4800.

NOAA works closely with the academic and science communities on climate-related research projects to increase the understanding of El Niño and improve forecasting techniques. NOAA's Climate Prediction Center monitors, analyzes and predicts climate events ranging from weeks to seasons for the nation. NOAA also operates the network of data buoys and satellites that provide vital information about the ocean waters, and initiates research projects to improve future climate forecasts.

page separator

For further information, contact:

Jay Lawrimore
NOAA/National Climatic Data Center
151 Patton Avenue
Asheville, NC 28801-5001
fax: 828-271-4328
email: Jay.Lawrimore@noaa.gov
-or-
Scott Stephens
NOAA/National Climatic Data Center
151 Patton Avenue
Asheville, NC 28801-5001
fax: 828-271-4328
email: Scott Stephens@noaa.gov

Climate Monitoring / Climate of 2002 / Annual / Help