Tropical Cyclone Report
Hurricane Charley
9 - 14 August 2004
Hurricane Charley strengthened rapidly just
before striking the southwestern coast of Florida as a Category 4
hurricane on the Saffir-Simpson Hurricane Scale. Charley was the
strongest hurricane to hit the United States since Andrew in 1992
and, although small in size, it caused catastrophic wind damage in
Charlotte County, Florida. Serious damage occurred well inland over
the Florida peninsula.
a. Synoptic History
A tropical wave emerged from western Africa
on 4 August. Radiosonde data from Dakar showed that this wave was
accompanied by an easterly jet streak of around 55 kt near the 650
mb level. The wave also produced surface pressure falls on the
order of 5 mb over 24 h near the west coast of Africa. On satellite
images this system was not particularly impressive just after
crossing the coast, since it had only a small area of associated
deep convection. As the wave progressed rapidly westward across the
tropical Atlantic, the cloud pattern gradually became better
organized, with cyclonic turning becoming more evident in the low
clouds. The first center position estimates were given by the
Tropical Analysis and Forecast Branch (TAFB) and the Satellite
Analysis Branch (SAB) in the vicinity of 9-10°N, 47°W at
2345 UTC 7 August, although at that time the system was still too
weak to classify by the Dvorak technique. The first Dvorak
T-numbers were assigned 24 h later, when the system was centered
near 11°N, 55°W. Curved banding of the deep convection
became better defined over the ensuing 12 h, and this, along with
surface observations from the southern Windward Islands, indicated
that a tropical depression had formed by 1200 UTC 9 August,
centered about 100 n mi south-southeast of Barbados. Figure 1
depicts the "best track" of the tropical cyclone's path. The wind
and pressure histories are shown in Figure 2 and Figure 3,
respectively.
Table 1 is a listing of the best track positions and
intensities.
Late on 9 August, the depression moved into
the southeastern Caribbean Sea. A strong deep-layer high pressure
area to the north of the tropical cyclone induced a swift
west-northwestward motion, at 20-24 kt. With low vertical shear and
well-established upper-level outflow, the depression strengthened
into Tropical Storm Charley early on 10 August. Fairly steady
strengthening continued while the storm moved into the central
Caribbean Sea, and when Charley approached Jamaica on 11 August, it
became a hurricane. By this time, the forward speed had slowed to
about 14 kt. Charley's core remained offshore of Jamaica; the
center passed about 35 n mi southwest of the southwest coast of the
island around 0000 UTC 12 August. The hurricane then turned
northwestward, and headed for the Cayman Islands and western Cuba.
It continued to strengthen, reaching Category 2 status around 1500
UTC 12 August, just after passing about 15 n mi northeast of Grand
Cayman. As Charley neared the western periphery of a
mid-tropospheric ridge, it turned toward the north-northwest, its
center passing about 20 n mi east of the east coast of the Isle of
Youth at 0000 UTC 13 August. The eye of the hurricane crossed the
south coast of western Cuba very near Playa del Cajio around 0430
UTC 13 August. Charley strengthened just before it hit western
Cuba. Cuban radar and microwave imagery suggests that the eye
shrank in size, and surface observations from Cuba indicate that
the maximum winds were about 105 kt as it crossed the island. By
0600 UTC, the eye was emerging from the north coast of Cuba, about
12 n mi west of Havana. Based on aerial reconnaissance
observations, Charley weakened slightly over the lower Straits of
Florida. Turning northward, the hurricane passed over the Dry
Tortugas around 1200 UTC 13 August with maximum winds near 95
kt.
By the time Charley reached the Dry
Tortugas, it came under the influence of an unseasonably strong
mid-tropospheric trough that had dug from the east-central United
States into the eastern Gulf of Mexico. In response to the steering
flow on the southeast side of this trough, the hurricane turned
north-northeastward and accelerated toward the southwest coast of
Florida. It also began to intensify rapidly at this time. By 1400
UTC 13 August, the maximum winds had increased to near 110 kt. Just
three hours later, Charley's maximum winds had increased to
Category 4 strength of 125 kt. Since the eye shrank considerably in
the 12 h before landfall in Florida, these extreme winds were
confined to a very small area - within only about 6 n mi of the
center. Moving north-northeastward at around 18 kt, Charley made
landfall on the southwest coast of Florida near Cayo Costa, just
north of Captiva, around 1945 UTC 13 August with maximum sustained
winds near 130 kt. Charley's eye passed over Punta Gorda at about
2045 UTC, and the eyewall struck that city and neighboring Port
Charlotte with devastating results. Continuing north-northeastward
at a slightly faster forward speed, the hurricane traversed the
central Florida peninsula, resulting in a swath of destruction
across the state. The center passed near Kissimmee and Orlando
around 0130 UTC 14 August, by which time the interaction with land
caused the maximum sustained winds to decrease to around 75 kt.
Charley was still of hurricane intensity, with maximum sustained
winds of 65-70 kt, when the center moved off the northeast coast of
Florida near Daytona Beach at around 0330 UTC 14 August.
After moving into the Atlantic, the
hurricane re-strengthened slightly as it accelerated
north-northeastward toward the coast of South Carolina. This
re-intensification proved to be temporary, however. Charley came
ashore again near Cape Romain, South Carolina at about 1400 UTC 14
August as a weakening hurricane with highest winds of about 70 kt.
The center then moved just offshore before making another landfall
at North Myrtle Beach, South Carolina at around 1600 UTC 14 August,
with intensity near 65 kt. Charley soon weakened to a tropical
storm over southeastern North Carolina, and began to interact with
a frontal zone associated with the same strong trough which had
recurved it over Florida. By 0000 UTC 15 August, as the center was
moving back into the Atlantic in the vicinity of Virginia Beach,
Virginia, synoptic data indicate that the cyclone had become
embedded in the frontal zone and was, therefore, an extratropical
system. Charley's extratropical remnant moved rapidly
north-northeastward to northeastward, and became indistinct within
the frontal zone near southeastern Massachusetts just after 1200
UTC 15 August.
b. Meteorological Statistics
Observations in Charley (Figure 2 and Figure 3)
include satellite-based Dvorak technique intensity estimates from
the Tropical Analysis and Forecast Branch (TAFB), the Satellite
Analysis Branch (SAB) and the U. S. Air Force Weather Agency
(AFWA), as well as flight-level and dropwindsonde observations from
flights of the 53rd Weather Reconnaissance Squadron of
the U. S. Air Force Reserve Command (AFRES). Microwave satellite
imagery from NOAA polar-orbiting satellites, the NASA Tropical
Rainfall Measuring Mission (TRMM), the NASA QuikSCAT, and Defense
Meteorological Satellite Program (DMSP) satellites were also
helpful in monitoring Charley. Finally, National Weather Service
doppler radars were extremely useful for tracking this tropical
cyclone. Figure 4 is a radar image of Charley around the time of
landfall on 13 August from the Tampa radar, and shows the very
small, well-defined eye of the hurricane.
Ship reports of winds of tropical storm
force associated with Charley are given in Table 2, and selected
surface observations from land stations and data buoys are given in
Table 3, Table 4, and Table 5.
Charley destroyed instruments at the C-MAN
observing site at Dry Tortugas.
Charley deepened extremely rapidly as it approached the southwest
coast of Florida. Based on dropsonde measurements on 13 August from the
AFRES, the central pressure fell from 964 mb at 1522 UTC to 941 mb at 1957
UTC, around the time of landfall, a deepening rate of about 5.02 mb/h . The
hurricane's peak intensity is estimated to be 130 kt, which occurred at
landfall in Cayo Costa, FL. This estimate is based on maximum 700 mb
flight-level winds of 148 kt measured in the southeastern quadrant of the
hurricane's eyewall at 1955 UTC 13 August. As usual, there were no official
surface anemometer measurements of wind speeds even approaching the
intensity estimate near the landfall location. The wind sensor at the Punta
Gorda ASOS site, which experienced the eyewall of Charley, stopped reporting
after measuring a sustained wind of 78 kt at 2034 UTC with a gust to 97 kt
at 2036 UTC. Ten minutes later, that site reported its lowest pressure,
964.5 mb. Since it is presumed that the center was closest to the Punta
Gorda site at the time of lowest pressure, and since Charley's maximum winds
covered an extremely small area, it is highly likely that much stronger
winds would have been observed at the site, had the wind instrument not
failed. Instrument failures remain a chronic problem in landfalling
hurricanes. Based on the few wind sensors that did not fail, Charley
carried strong winds well inland along its path across the Florida
peninsula. For example, Orlando International Airport measured sustained
winds of hurricane force (69 kt), with a gust to 91 kt.
Observations from Cuba (Table 3) indicate
that Charley was of Category 3 intensity as it crossed the island.
Radar and microwave imagery suggest that the hurricane was
strengthening as it approached the south coast of Cuba. Storm surge
heights of 13.1 ft were determined from high water marks at Playa
Cajio on the south coast.
Rainfall totals of up to about 5 inches
were reported in western Cuba. Maximum rainfall totals from gauges
in Florida ranged up to a little over 5 inches, but radar-estimated
storm total precipitation over central Florida were as high as 6 to
8 inches.
There were nine tornadoes reported across
the Florida peninsula in association with Charley, all of which
occurred on 13 August. There was 1 tornado in Lee County (a
waterspout that moved onshore), 1 in Hendry County, 1 in DeSoto
County, 1 in Hardee County, 2 in Polk County, 1 in Osceola County,
and 2 in Volusia County. The strongest tornado was in south Daytona
Beach. This tornado struck around 2326 UTC, and produced a quarter
mile long track of F1 damage. There were five tornadoes reported in
eastern North Carolina on 14 August, in Onslow, Pitt, (mainland)
Hyde, Tyrrell, and (Outer Banks) Dare Counties. The tornado in Dare
County produced F1 damage in Kitty Hawk. There were also two
tornadoes observed in Virginia, in Chesapeake and Virginia
Beach.
A storm surge of 4.2 feet was measured by a
tide gauge in Estero Bay, near Horseshoe Key. This is near Fort
Myers Beach. Storm surges of 3.4 and 3.6 feet were measured on tide
gauges on the Caloosahatchee River, near Fort Myers. There were
also visual estimates of storm surges of 6 to 7 feet on Sanibel and
Estero Islands.
c. Casualty and Damage Statistics
Charley was directly responsible for 10
deaths in the United States. In Charlotte County, Florida a husband
and wife, who were in a mobile home destroyed by the hurricane,
were killed, and two men died after being struck by flying debris.
In Lee County, Florida, a man died as a result of a tree falling
onto the structure he was in. In Sarasota County, Florida, the
severe weather associated with Charley caused a woman to drive off
the road and hit a tree, resulting in her death. In DeSoto County,
Florida, a man was killed while in a tool shed hit by strong winds.
In Orange County, Florida, a girl died as a result of strong winds
blowing a moving van into the vehicle she was in, and in Polk
County, Florida, a man drowned when he drove off of a flooded
highway into a lake. In Rhode Island, a man drowned in a rip
current. There were also 4 deaths in Cuba and 1 in Jamaica.
Therefore, the direct death toll due to Charley stands at 15. An
additional 20 U.S. deaths, all in Florida, were indirectly caused
by Charley.
There are two estimates of insured damages
in the United States from Hurricane Charley. The Property Claims
Service reports insured damages of 6.755 billion dollars in
Florida, 25 million dollars in North Carolina and 20 million
dollars in South Carolina, making a total of 6.8 billion dollars in
insured losses. The Insurance Information Institute reports an
estimated total of 7.4 billion dollars in insured losses. Using a
two to one ratio of total damages to these two insured damage
amounts, a rough preliminary estimate of the total damage is 14
billion dollars. This would make Charley the second costliest
hurricane in U.S. history.
d. Forecast and Warning Critique
Average official track errors (with the
number of cases in parentheses) for Charley were 37 (20), 71 (18),
89 (16), 83 (14), 176 (10), 459 (6), and 777 (2) n mi for the 12,
24, 36, 48, 72, 96, and 120 h forecasts, respectively. In
comparison, the longer-term average official track errors for the
10-yr period 1994-2003[1] are 44, 78, 112, 146, 217, 248,
and 319 n mi. So the mean official track forecasts for Charley were
better than the 10-yr average through 72 h, and significantly worse
at 96 h and 120 h. It should be noted that there were very few
forecasts to verify for the latter two forecast times, however.
Table 6 lists the average errors from various numerical track
prediction techniques for Charley. The GFS and FSU Superensemble
generally performed best at hours 12-48, and the GFDL was best
overall at 72-120 h - albeit for a small number of cases. Average
official intensity errors were 7, 9, 14, 19, 25, 23 and 8 kt for
the 12, 24, 36, 48, 72, 96, and 120 h forecasts, respectively. For
comparison, the average official intensity errors over the 10-yr
period 1994-2003 are 6, 10, 12, 15, 19, 20, and 21 kt,
respectively.
For about 24 h prior to hitting the United
States, the official intensity forecasts called for Charley to
strengthen from a category 2 to a category 3 hurricane by landfall
on the west coast of Florida. A special advisory package was issued
around 1800 UTC 13 August to report that Charley had strengthened
into a Category 4 hurricane. In this special advisory, a revised,
eastward-shifted, track forecast was also issued, to account for a
modest (by historical measures) deviation from the forecast
track.
Although the official track forecasts for
the landfall of Charley on the Florida west coast did, in general,
have a left bias, the hurricane made landfall within the area
covered by the hurricane watch and warning. One day prior to the
Florida landfall, the 24-h track forecast error was 40 n mi, which
is below the long-term average. Table 7 lists all of the watches
and warnings issued for Charley. It can be seen that a hurricane
watch was issued for the southwest coast of Florida, including the
landfall location, just less than 35 h prior to landfall on that
coast. A hurricane warning was issued for the same area just less
than 23 h prior to landfall. No one near the landfall location
should have been surprised by the arrival of this hurricane.
[1]Errors given
for the 96 and 120 h periods are averages over the three-year
period 2001-3.
Table 1: Best track for Hurricane Charley,
9-14 August 2004.
Date/Time
(UTC) | Position | Pressure
(mb) | Wind Speed
(kt) | Stage |
Lat.
(°N) | Lon.
(°W) |
| 09 / 1200 | 11.4 | 59.2 | 1010 | 30 | tropical
depression |
| 09 / 1800 | 11.7 | 61.1 | 1009 | 30 | " |
| 10 / 0000 | 12.2 | 63.2 | 1009 | 30 | " |
| 10 / 0600 | 12.9 | 65.3 | 1007 | 35 | tropical storm |
| 10 / 1200 | 13.8 | 67.6 | 1004 | 40 | " |
| 10 / 1800 | 14.9 | 69.8 | 1000 | 45 | " |
| 11 / 0000 | 15.6 | 71.8 | 999 | 55 | " |
| 11 / 0600 | 16.0 | 73.7 | 999 | 55 | " |
| 11 / 1200 | 16.3 | 75.4 | 995 | 60 | " |
| 11 / 1800 | 16.7 | 76.8 | 993 | 65 | hurricane |
| 12 / 0000 | 17.4 | 78.1 | 992 | 65 | " |
| 12 / 0600 | 18.2 | 79.3 | 988 | 75 | " |
| 12 / 1200 | 19.2 | 80.7 | 984 | 80 | " |
| 12 / 1800 | 20.5 | 81.6 | 980 | 90 | " |
| 13 / 0000 | 21.7 | 82.2 | 976 | 90 | " |
| 13 / 0600 | 23.0 | 82.6 | 966 | 105 | " |
| 13 / 1200 | 24.4 | 82.9 | 969 | 95 | " |
| 13 / 1400 | 24.9 | 82.8 | 965 | 110 | " |
| 13 / 1700 | 25.7 | 82.5 | 954 | 125 | " |
| 13 / 1800 | 26.1 | 82.4 | 947 | 125 | " |
| 14 / 0000 | 28.1 | 81.6 | 970 | 75 | " |
| 14 / 0600 | 30.1 | 80.8 | 993 | 75 | " |
| 14 / 1200 | 32.3 | 79.7 | 988 | 65 | " |
| 14 / 1800 | 34.5 | 78.1 | 1000 | 60 | tropical
storm |
| 15 / 0000 | 36.9 | 75.9 | 1012 | 40 | extratropical |
| 15 / 0600 | 39.3 | 73.8 | 1014 | 35 | " |
| 15 / 1200 | 41.2 | 71.1 | 1018 | 30 | " |
| 15 / 1800 | | | | | merged with front |
| 13 / 0430 | 22.7 | 82.6 | 966 | 105 | landfall on south coast of Cuba
near Playa del Cajio |
| 13 / 1945 | 26.6 | 82.2 | 941 | 130 | landfall near Cayo Costa, FL, and
minimum pressure |
| 13 / 2045 | 26.9 | 82.1 | 942 | 125 | Landfall near Punta Gorda, FL |
| 14 / 1400 | 33.0 | 79.4 | 992 | 70 | landfall near Cape Romain, SC |
| 14 / 1600 | 33.8 | 78.7 | 997 | 65 | landfall near North Myrtle Beach, SC |
Table 2: Selected ship reports with winds
of at least 34 kt for Hurricane Charley, 9-14 August 2004.
| Ship Name or Call Sign | Date/Time (UTC) | Lat.
(°N) | Lon.
(°W) | Wind dir/speed (deg/kt) | Pressure (mb) |
| 3FPS9 | 10 / 0600 | 19.4 | 66.6 | 130 / 98 | 1018.0 |
| WCZ523 | 10 / 2100 | 16.1 | 70.2 | 110 / 47 | 1010.0 |
| 41545 | 11 / 0100 | 22.1 | 71.1 | missing / 39 | 1018.7 |
| C6YC | 13 / 0900 | 23.4 | 82.0 | 160 / 55 | 1008.0 |
| C6YC | 13 / 1200 | 23.2 | 82.9 | 230 / 52 | 1009.0 |
| WDA406 | 14 / 0600 | 29.1 | 77.4 | 130 / 35 | 1018.0 |
| WDA406 | 14 / 1200 | 28.9 | 78.6 | 150 / 35 | 1017.1 |
| WGMJ | 14 / 1500 | 31.7 | 77.6 | 180 / 38 | 1018.3 |
| A8BZ6 | 15 / 0300 | 37.0 | 74.6 | 220 / 42 | 1017.0 |
|
Table 3: Selected surface observations for
Hurricane Charley, 9-14 August 2004.
| | Minimum
Sea-level
Pressure | Maximum Surface Wind Speed
(kt) | |
| Location | Date/
Time
(UTC) | Press.
(mb) | Date/
Timea
(UTC) | Sust.
Windb
(kts) | Peak
Gust (kts) | Storm
Surgec
(ft) | Storm
Tided
(ft) | Rain
(storm total)
(in) |
| Grand Cayman Islands |
| Grand Cayman | 12/1300 | 1008.2 | 12/1142 | 21 | 34 | | | 0.90 |
| Cayman Brac | 12/0800 | 1008 | 12/1615 | 35 | 49 | | | 0.12 |
| Cuba |
| Punta del Este | 13/0000 | 1001.7 | 13/0100 | 36 | 45 | | | 4.95 |
| Nueva Gerona | 13/0200 | 1006.2 | 13/0045 | 39 | 49 | | | 1.95 |
| San Antoniode los Banos | 13/0453 | 989.4 | 13/0453 | 97 | 115 | | | |
| Guira de Melena | 13/0459 | 971.6 | 13/0450 | 92 | 116 | | | 3.88 |
| Bauta | 13/0530 | 971.0 | | | | | | 3.34 |
| Playa Baracoa | 13/0605 | 974 | 13/0530 | 103 | 130 | | | |
| Santiagode las Vegas | 13/0501 | 990.7 | 13/0620 | 63 | 79 | | | 4.19 |
| Casa Blanca | 13/0530 | 1001.7 | 13/0630 | 61 | 76 | | | 2.22 |
| Playa Cajio | | | | | | 13.1 | | |
| Florida |
| Key West (KEYW) | 13/1153 | 1009.8 | 13/1413 | 42 | 50 | | | 1.44 |
| Key West Naval Air Station (KNQX) | 13/1155 | 1010.2 | 13/1255 | 34 | 45 | | | 1.23 |
| Marathon (KMTH) | 13/0953 | 1012.4 | 13/1506 | | 34 | | | 0.53 |
| Summerland Key (NWS Handar) | | | 13/1250 | 29 | 45 | | | 0.30 |
| Big Pine Key (NWS Handar) | | | 13/1350 | 31 | 39 | | | 0.37 |
| Naples* (KAPF) | 13/1905 | 1004.4 | 13/1806 | 38 | 48 | | | 1.75 |
| Everglades City (KEGC) | | | 13/1801 | 40 | 55 | | | |
| Flamingo (KFLM) | | | 13/1606 | 38 | 47 | | | |
| Miami (KMIA) | 13/1941 | 1013 | 13/1710 | 26 | 34 | | | 0.47 |
| Fort Lauderdale (KFLL) | 13/1929 | 1010 | 13/1900 | 25 | 33 | | | 0.41 |
| West Palm Beach (KPBI) | 13/2045 | 1013 | 13/2000 | 26 | 33 | | | 0.40 |
| Brighton Reservation CO-OP | | | | | | | | 1.92 |
| Clewiston CO-OP | | | | | | | | 1.65 |
| Devils Garden CO-OP | | | | | | | | 1.75 |
| Marco Island CO-OP | | | | | | | | 1.04 |
| Golden Gate CO-OP | | | | | | | | 2.08 |
| Punta Gorda (KPGD)* | 13/2046 | 964.5 | 13/2034 | 78 | 97 | | | |
| Fort Myers (KFMY) | 13/1953 | 998.1 | 13/2009 | 43 | 66 | | | |
| Fort Myers (KRSW) | 13/1957 | 1001.4 | 13/1949 | 53 | 68 | | | |
| Sarasota (KSRQ) | 13/2121 | 1003.4 | 13/0801 | 27 | 31 | | | |
| St. Petersburg (KPIE) | 13/2259 | 1008.5 | 13/2205 | 22 | 28 | | | |
| St. Petersburg (KSPG) | 13/2242 | 1007.1 | 13/0850 | 27 | 32 | | | |
| Tampa (KTPA) | 13/2332 | 1007.8 | 13/2257 | 20 | 26 | | | |
| Winter Haven (KGIF) | 13/2305 | 1000.3 | 13/2302 | 41 | 54 | | | |
| Kissimmee (KISM)* | | | 14/0035 | 53 | 65 | | | 5.20 |
| Orlando (KMCO)* | 14/0139 | 984.2 | 14/0134 | 69 | 91 | | | 2.11 |
| Orlando (KORL)* | 14/0129 | 980.7 | 14/0129 | 57 | 74 | | | 2.37 |
| Sanford (KSFB)* | 14/0213 | 983.4 | 14/0210 | 63 | 80 | | | 3.49 |
| Lessburg (KLEE) | 14/0158 | 1005.1 | 14/0135 | 29 | 34 | | | |
| Patrick AFB (KCOF) | | | 14/0044 | 28 | 43 | | | |
| Daytona Beach (KDAB)* | | | 14/0353 | 48 | 72 | | | 3.43 |
| Ormond Beach (KOMN) | | | 14/0315 | 59 | 76 | | | |
| Melbourne (KMLB) | 14/0100 | 1010.5 | 14/0222 | 29 | 39 | | | 1.44 |
| Ft.Pierce (KFPR) | | | 13/1910 | 21 | 26 | | | |
| Stuart (KSUA) | | | 13/1955 | 20 | 31 | | | |
| Vero Beach (KVRB) | | | 14/0136 | 23 | 30 | | | |
| Gainesville (KGNV) | 14/0442 | 1011.6 | 14/1952 | 10 | 13 | | | 0.04 |
| Jacksonville (KJAX) | 14/0612 | 1009.9 | 14/0358 | 17 | 20 | | | |
| Craig Field (Jacksonville) (KCRG) | 14/0521 | 1008.2 | 14/0501 | 21 | 29 | | | |
| NAS Jacksonville (KNIP) | 14/0456 | 1012.4 | 14/0433 | 30 | 34 | | | |
| NAS Mayport (KNRB)* | 14/0529 | 1007.2 | 14/0430 | 37 | 46 | | | |
| Fernandina Beach NOS | 14/0700 | 1008.5 | 14/0742 | 18 | 28 | 0.89 | 2.68 | 0.67* |
| Mayport NOS | 14/0700 | 1008.3 | 14/0500 | 30 | 42 | 1.61 | 2.19 | |
| Vilano Beach NOS (29.9°N 81.3W) | | | 14/0500 | 27 | 44 | | | |
| Bings Landing NOS(29.6°N 81.2°W) | 14/0500 | 1000.6 | 14/0500 | 18 | 57 | | | |
| Cresent Beach NOS(29.8°N 81.3°W) | | | 14/0500 | 26 | 58 | | | |
| Georgia |
| St.Simons Island (KSSI) | 14/0723 | 1009.5 | 14/0654 | 18 | 22 | 0.68 | 3.82 | |
| Alma (KAMG) | 14/0747 | 1012.9 | 14/2103 | 8 | 11 | | | 0.01 |
| Baxley CO-OP | | | | | | | | 0.51 |
| Savannah (KSAV) | 14/1024 | 1012 | 14/1143 | 13 | 17 | | | 0.53 |
| South Carolina |
| Charleston (KCHS) | 14/1258 | 1008 | 14/1322 | 25 | 33 | | | 1.02 |
| North Myrtle Beach (KCRE) | 14/1609 | 998 | 14/1538 | 36 | 50 | | | 1.52 |
| Myrtle Beach (KMYR) | | | 14/1550 | 35 | 45 | | | |
| Florence (KFLO) | 14/1552 | 1014 | 14/1742 | 20 | 25 | | | 0.03 |
| North Carolina |
| Wilmington (KILM) | 14/1750 | 1005 | 14/1731 | 48 | 64 | | | 2.02 |
| Southport (KSUT) | | | 14/1700 | 33 | 51 | | | 2.26 |
| Elizabethtown CO-OP | | | | | | | | 3.32 |
| Burgaw CO-OP | | | | | | | | 3.32 |
| Whiteville CO-OP | | | | | | | | 3.22 |
| New River (KNCA) | 14/1815 | 1008.1 | 14/1929 | 42 | 57 | | | |
| New Bern (KEWN) | 14/1900 | 1012.1 | 14/1847 | 34 | 46 | | | 1.26 |
| Cherry Point (KNKT) | 14/1855 | 1014.1 | 14/1857 | 31 | 44 | | | 2.08 |
| Beaufort (KMRH) | 14/1756 | 1017.1 | 14/1915 | 32 | 43 | | | 1.40 |
| Cape Hatteras (KHSE) | 14/2051 | 1017.4 | 14/2154 | 26 | 32 | | | 0.01 |
| Manteo (KMQI) | 14/2120 | 1015.1 | 14/2200 | | 35 | | | |
| Washington (KOCW) | 14/1900 | 1012.4 | 14/2001 | | 50 | | | |
| Edenton (KEDE) | | | 14/2140 | 38 | 56 | | | |
| Jacksonville (KOAJ) | 14/1835 | 1012.4 | 14/1835 | | 48 | | | 1.73 |
| Kinston (KISO) | 14/1920 | 1009 | 14/1920 | | 40 | | | |
| Greenville (KPGV) | 14/1901 | 1010.4 | 14/1921 | | 32 | | | |
| Elizabeth City (KECG) | 14/2106 | 1011 | 14/2249 | 38 | 56 | | | 2.30 |
| Greenville CO-OP | | | | | | | | 5.05 |
| Kinston CO-OP | | | | | | | | 4.38 |
| Richlands CO-OP | | | | | | | | 3.41 |
| Williamston CO-OP | | | | | | | | 2.50 |
| Ocracoke CO-OP | | | | | | | | 0.04 |
| Virginia |
| Norfolk (KORF) | 14/2305 | 1013 | 14/2208 | 31 | 39 | | | 3.72 |
| Norfolk NAS (KNGU) | 14/2356 | 1013 | 14/2314 | 27 | 38 | | | 2.66 |
| Newport News (KPHF) | | | 14/2218 | 16 | 27 | | | 2.34 |
| Hampton - Langley AFB (KLFI) | | | 14/2214 | e30 | e42 | | | |
| Wallops Island | 14/2354 | 1017 | 14/2354 | 18 | 23 | | | 3.17 |
| Washington National (KDCA) | 15/0051 | 1020.1 | | 13 | 16 | | | 0.60 |
| Maryland |
| Ocean City (KOXB) | | | 15/0053 | 17 | 25 | | | 1.86 |
| Patuxent NAS (KNHK) | 14/2355 | 1018.2 | 14/2355 | 15 | | | | |
| Baltimore (KBWI) | 15/0054 | 1020.0 | 15/0054 | 7 | 16 | | | 0.29 |
aDate/time is for wind gust when both sustained and gust are listed.
bExcept as noted, sustained wind averaging periods for C-MAN and land-based ASOS reports are
2 min; buoy averaging periods are 8 min.
cStorm surge is water height above normal astronomical tide level.
dStorm tide is water height above National Geodetic Vertical Datum (1929 mean sea level).
*Instrument failed. |
Table 4: Selected Buoy and C-MAN
observations for Hurricane Charley, 9-14 August 2004.
| | Minimum
Sea-level
Pressure | Maximum Surface Wind Speed
(kt) | |
| Location | Date/
Time
(UTC) | Press.
(mb) | Date/
Timea
(UTC) | Sust.
Windb
(kts) | Peak
Gust (kts) | Storm
Surgec
(ft) | Storm
Tided
(ft) | Rain
(storm total)
(in) |
| C-MAN |
| Sand Key (SANF1) | 13/1159 | 1007.8 | 13/1159 | 44 | 54 | | | |
| Sombrero Key (SMKF1) | 13/1059 | 1012.4 | 13/1449 | 41 | 56 | 1.83 | | |
| Long Key (LONF1) | 13/1159 | 1012.0 | 13/1329 | 38 | 53 | 1.81 | | |
| Molasses Reef (MLRF1) | 13/0853 | 1012.9 | 13/0359 | 34 | 47 | | | |
| Dry Tortugas (DRYF1)* | 13/1059 | 1004.7 | 13/1059 | 36 | 46 | | | |
| Northwest Florida Bay (NFBF1) (USF) | 13/1200 | 1011.6 | 13/1554 | 31 | 39 | 2.13 | | |
| Egmont Key (EGKF1) | | | 13/2100 | 23 | 27 | | | |
| Anna Maria (ANMF1) | 13/2000 | 1008.1 | 13/2230 | 27 | 29 | | | |
| St. Augustine (SAUF1) | 14/0505 | 1000.7 | 14/0450 | 51 | 63 | | | |
| Folly Beach (FBIS1) | 14/1300 | 1005 | 14/1200 | 41 | 50 | | | |
| US Navy Tower (SPAG1)(31.4°N 80.6°W) | 14/1305 | 990 | | | | | | |
| Duck (DUCN7) | 14/2100 | 1016.1 | 14/2200 | 32 | 47 | | | |
| Cape Lookout (CLKN7) | 14/1900 | 1015.9 | 14/2000 | 30 | 46 | | | |
| Frying Pan Shoals (FPSN7) | 14/1600 | 1014.4 | 14/1700 | 33 | 43 | | | |
| Chesapeake Light (CHLV2) | 14/2200 | 1013 | 14/2251 | 43 | 63 | | | |
| Buoys |
| Buoy 41009 - East of Cape Canaveral (28.5°N 80.2°W) | 14/0150 | 1011.0 | 14/0150 | 35 | 44 | | | |
| Buoy 41012 - St. Augustine (30.0°N 80.6°W) | 14/0650 | 999.0 | 14/0450 | 37 | 47 | | | |
| Buoy 41004 - Edisto(32.5°N 79.1°W) | 14/1250 | 1001 | 14/1250 | 43 | 64 | | | |
| Buoy 41008 - Grays Reef (31.4°N 80.9°W) | 14/0850 | 1005 | 14/0850 | 33 | 43 | | | |
| Buoy 41013 - Frying Pan Shoals (33.5°N 77.6°W) | 14/1550 | 1014.4 | 14/1650 | 36 | 49 | | | |
| Buoy 44009 - Delaware Bay (38.5°N 74.7°W) | | | 15/0350 | 25 | 31 | | | |
aDate/time is for wind gust when both sustained and gust are listed.
bExcept as noted, sustained wind averaging periods for C-MAN and land-based ASOS reports are
2 min; buoy averaging periods are 8 min.
cStorm surge is water height above normal astronomical tide level.
dStorm tide is water height above National Geodetic Vertical Datum (1929 mean sea level).
*Instrument failed. |
Table 5: Unofficial observations for
Hurricane Charley, 9-14 August 2004.
| | Minimum
Sea-level
Pressure | Maximum Surface Wind Speed
(kt) | |
| Location | Date/
Time
(UTC) | Press.
(mb) | Date/
Timea
(UTC) | Sust.
Windb
(kts) | Peak
Gust (kts) | Storm
Surgec
(ft) | Storm
Tided
(ft) | Rain
(storm total)
(in) |
| Florida |
| Key West Harbor | 13/1200 | 1010.2 | 13/1612 | 32 | 44 | 1.44 | | |
| Cudjoe Key | | | 13/1205 | | 44 | | | |
| Duck Key | | | 13/0300 | 33 | 45 | | | |
| Curry Hammock St. Park | | | | | | | | 1.04 |
| Tavernier | | | | | | | | 0.70 |
| Dry Tortugas / Fort Jefferson | | | | | | 6.0e | | |
| Lake Okeechobee | | | 13/2000 | 35 | | | | |
| Vanderbilt Beach* | | | 13/1950 | | 73 | | | |
| Naples | | | 13/1930 | | 47 | | | |
| Moore Haven | | | 13/2045 | | 36 | | | |
| Immokalee | | | 13/2015 | | 26 | | | |
| North Naples | | | | | | | | 7.48 |
| Arcadia EOC | 13/2130 | 975.7 | 13/2140 | | 90 | | | |
| Charlotte County Airport | | | 13/2035 | | 139 | | | |
| Charlotte County Medical Center | | | 13/2035 | | 150 | | | |
| Port
Charlotte | | | 13/2000 | | 61 | | | |
| Storm Chaser Mark Sudduth, near Port Charlotte
(27.0°N 82.0°W) | 13/2057 | 943.6 | 13/2046 | 80 | 115 | | | |
| Storm Chaser Jim Leonard
in Port Charlotte, near Faucet Memorial Hospital | 13/2051 | 950.0 | | | | | | |
| Storm Chaser Mike Theiss, near Charlotte Harbor | 13/2042 | 942.0 | | | | | | |
| Storm Chaser Jim Edds in Punta Gorda | 13/e2042 | 943.0 | | | | | | |
| Big Carlos Pass (Lee County) (26.4°N 81.9°W) | 13/1954 | 997.1 | 13/1936 | 60 | 83 | | | |
| Plant City | | | 13/2355 | | 54 | | | |
| Fort Myers Beach | | | 13/1930 | | 56 | | | |
| For Myers | | | 13/2023 | | 83 | | | |
| Cape Coral | | | 13/1940 | | 78 | | | |
| Matanzas Pass Fort Myers Beach | | | | | | 5.82 | | |
| Estero Bay Horseshoe Key | | | | | | 4.46 | | |
| Port Boca Grand | | | | | | 4.30 | | |
| Sarasota | | | 13/2119 | | 44 | | | |
| Lakeland | | | 13/2336 | | 50 | | | |
| Haines City | | | 13/2325 | | 67 | | | |
| Lake Wales (10 mi East) | | | 13/2300 | | 65 | | | |
| Poinciana | | | 14/0000 | | 39 | | | |
| Archbold | | | 13/2100 | | 49 | | | |
| NASA Wind Tower 421 (28.78°N 80.8°W) | | | 14/0250 | 56 | 75 | | | |
| NASA Wind Tower 22 (28.8°N 80.8°W) | | | 14/0250 | 53 | 75 | | | |
| Daytona Beach International Airport Wind Shear | | | 14/0325 | | 84 | | | |
| South Florida Water Management District (SFWMD) station WRWX
Polk County (28.05°N 81.40°W) | 14/0015 | 991.3 | 13/2116 | | 57 | | | |
| SFWMD S65DWX Highlands County (27.31°N 81.02°W) | | | 13/2306 | | 50 | | | |
| SFWMD S61W (28.14°N 81.35°W) | 14/0030 | 990.7 | 14/0028 | | 78 | | | |
| SFWMD S65CW (27.40°N 81.11°W) | | | 13/2242 | | 50 | | | |
| SFWMD S65DWX (27.31°N 81.02°W) | | | 13/2216 | | 50 | | | |
| SFWMD L001 (27.14°N 80.79°W) | | | 13/2234 | | 46 | | | |
| South Carolina |
| Downtown Charleston (wind - 10 min. avg.) | | | 14/1238 | 32 | 44 | | | 2.09 |
| Pineville (wind - 10 min. avg.) | | | 14/1520 | 17 | 24 | | | 0.19 |
| Isle of Palms | | | 14/1230 | 43 | 55 | | | 2.00 |
| Hampton | | | | | | | | 1.53 |
| Ravenel | | | | | | | | 0.45 |
| Walterboro | | | | | | | | 0.40 |
| Summerville | | | | | | | | 0.24 |
| Charleston Harbor | | | | | | 2.0e | | |
| Oyster Landing (N. Charleston County) | | | | | | 2.94 | | |
| Myrtle Beach Springmaid Pier (wind - 6 min. avg.) | 14/1542 | 998.2 | 14/1506 | 39 | 53 | 6.0e | 7.19 | |
| Little River FD | | | | | 50 | | | 1.69 |
| Myrtle Beach Pavilion | | | | | 65 | | | 2.60 |
| Loris | | | | | 50 | | | 3.09 |
| Conway | | | | | | | | 4.25 |
| Conway Horry County EOC | | | | | | | | 3.97 |
| Outland (Georgetown County) | | | | | | | | 2.97 |
| North Carolina | | | | | | | | |
| Wrightsville Beach Johnnie Mercer Pier (wind - 6 min. avg.) | 14/1736 | 1007.3 | 14/1736 | 61 | 74 | | | |
| Sunset Beach | 14/1600 | 998 | 14/1500 | 46 | 53 | | | |
| Surf City | | | | | 44 | | | |
| Watha | | | | | 39 | | | |
| Wilmington Battleship USS North Carolina | | | | | 61 | | | 1.39 |
| UNC Wilmington Marine Science Center | | | | | 72 | | | 2.14 |
| Wrightsville Beach US Coast Guard Station | | | | | 63 | | | |
| North Carolina St Port | | | | | 80 | | | |
| Bay Shore Estates | | | | | 81 | | | |
| Carolina Beach | | | | | 61 | | | |
| Myrtle Grove | | | | | 55 | | | |
| Southport | | | | | 74 | | | |
| Oak Island (39th Place West) | | | | | 66 | | | |
| Oak Island (43rd St. East) | | | | | 53 | | | |
| St. James Plantation | | | | | 58 | | | |
| Holden Beach | | | | | 74 | | | |
| Cedar Island | | | 14/2000 | | 42 | | | |
| Brunswick County | | | | | | 7-8e | | |
| Bald Head Island | | | | | | 2-3e | | |
| New Hanover County Onslow Bay | | | | | | 5.0e | | |
| Pender County | | | | | | 4.0e | | |
| Onslow County | | | | | | 2-3e | | |
| Carteret County Bogue Banks | | | | | | 2-3e | | |
| Whiteville Columbus County Airport | | | | | | | | 1.88 |
| Lumberton | | | | | | | | 0.62 |
| Longwood | | | | | | | | 1.80 |
| Moores Creek | | | | | | | | 1.56 |
| Newport | | | | | | | | 2.30 |
| Havelock | | | | | | | | 2.28 |
| Perrytown | | | | | | | | 1.23 |
| Virginia |
| Chesapeake BBT | 15/0000 | 1013 | 14/2154 | 45 | 51 | | | |
| Sewell's Point | 14/2212 | 1015 | 14/2336 | 38 | 49 | | | |
| Kiptopeke | | | 14/2348 | 25 | 36 | | | |
| Maryland |
| Ridge | | | | | 16 | | | 2.07 |
aDate/time is for wind gust when both sustained and gust are listed.
bExcept as noted, sustained wind averaging periods for C-MAN and land-based ASOS reports are
2 min; buoy averaging periods are 8 min.
cStorm surge is water height above normal astronomical tide level.
dStorm tide is water height above National Geodetic Vertical Datum (1929 mean sea level).
eestimated |
Table 6: Preliminary forecast evaluation
(heterogeneous sample) for Hurricane Charley, 9-14 August 2004.
Forecast errors (n mi) are followed by the number of forecasts in
parentheses. Errors smaller than the NHC official forecasts are
shown in bold-face type. Verification includes the depression
stage.
| Forecast Technique | Period (hours) |
| 12 | 24 | 36 | 48 | 72 | 96 | 120 |
| CLP5 | 53 (20) | 130 (18) | 201 (16) | 258 (14) | 394 (10) | 587 (6) | 969 (2) |
| GFNI | 52 (17) | 97 (13) | 156 (11) | 227 (9) | 227 (5) | | |
| GFDI | 40 (19) | 75 (17) | 101 (15) | 124 (13) | 159 (9) | 396 (5) | 797 (1) |
| GFDL | 36 (19) | 66 (17) | 89 (15) | 119 (13) | 128 (9) | 276 (5) | 629 (1) |
| GFDN | 56 (17) | 96 (14) | 147 (12) | 206 (10) | 326 (5) | | |
| LBAR | 43 (20) | 81 (18) | 109 (16) | 134 (14) | 204 (10) | 381 (6) | 726 (2) |
| GFSI | 35 (18) | 63 (16) | 91 (14) | 117 (11) | 169 (7) | 430 (3) | |
| GFSO | 35 (19) | 54 (17) | 74 (14) | 103 (12) | 167 (8) | 362 (4) | |
| AEMI | 33 (11) | 80 (9) | 111 (7) | 144 (5) | 67 (3) | | |
| AEMN | 40 (12) | 59 (10) | 91 (8) | 140 (6) | 64 (2) | 73 (1) | |
| BAMD | 50 (20) | 102 (18) | 163 (16) | 239 (14) | 358 (10) | 552 (6) | 956 (2) |
| BAMM | 52 (20) | 104 (18) | 156 (16) | 218 (14) | 348 (10) | 440 (6) | 711 (2) |
| BAMS | 60 (20) | 111 (18) | 154 (16) | 189 (14) | 308 (10) | 394 (6) | 649 (2) |
| NGPI | 49 (18) | 80 (16) | 105 (14) | 154 (12) | 302 (8) | 614 (4) | |
| NGPS | 62 (18) | 93 (16) | 109 (14) | 133 (12) | 245 (8) | 526 (5) | 1151 (1) |
| UKMI | 51 (16) | 98 (14) | 159 (12) | 221 (10) | 352 (7) | 697 (2) | |
| UKM | 64 (9) | 94 (8) | 136 (7) | 204 (6) | 338 (4) | 495 (1) | |
| A98E | 50 (20) | 99 (18) | 140 (16) | 170 (14) | 341 (10) | 592 (6) | 1064 (2) |
| A9UK | 55 (10) | 110 (9) | 154 (8) | 190 (7) | 305 (5) | | |
| GUNS | 44 (16) | 76 (14) | 103 (12) | 130 (10) | 224 (7) | 684 (2) | |
| GUNA | 39 (16) | 67 (14) | 90 (12) | 109 (10) | 187 (7) | 641 (2) | |
| FSSE | 36 (16) | 59 (14) | 79 (12) | 96 (10) | 187 (7) | 572 (3) | |
| CONU | 42 (18) | 71 (16) | 97 (14) | 119 (12) | 173 (8) | 459 (4) | |
| OFCL | 37 (20) | 71 (18) | 89 (16) | 83 (14) | 176 (10) | 459 (6) | 777 (2) |
| NHC Official, 1994-2003 mean (number of cases) | 44 (3172) | 78 (2894) | 112 (2636) | 146 (2368) | 217 (1929) | 248 (421) | 319 (341) |
|
Table 7: Table 7. Watch and warning summary for
Hurricane Charley, 9-14 August 2004.
| Date/Time | Action | Location |
| 10/1500 | Tropical Storm Watch Issued | Jamaica |
| 10/2100 | Tropical Storm Watch Issued | Cayman Islands |
| 10/2100 | Tropical Storm Watch changed to Tropical Storm
Warning | Jamaica |
| 10/2100 | Tropical Storm Warning issued | Southwest Peninsula of Haiti from the
Dominican Republic border westward including Port-au-Prince |
| 11/0300 | Hurricane Watch Issued | Jamaica |
| 11/0300 | Tropical Storm Watch changed to Tropical Storm
Warning and Hurricane Watch | Cayman Islands |
| 11/0900 | Hurricane Watch Issued | Florida Keys from the Dry Tortugas to Craig
Key |
| 11/0900 | Tropical Storm Warning and Hurricane Watch
changed to Hurricane Warning | Cayman Islands |
| 11/1500 | Tropical Storm Warning Discontinued | Southwest Peninsula of Haiti from the
Dominican Republic border westward including Port-au-Prince |
| 11/1500 | Hurricane Watch Issued | Cuban provinces
of Pinar Del Rio, La Habana, Ciudad de la Habana, Matanzas, and the
Isle of Youth |
| 11/2100 | Tropical Storm Warning and Hurricane Watch
changed to Hurricane Warning | Jamaica |
| 11/2100 | Hurricane Watch Issued | East of Craig Key to Ocean Reef including
Florida Bay and SW Florida from Flamingo to Bonita Beach |
| 12/0300 | Hurricane Watch Issued | North of Bonita Beach Florida to Anna Maria
Island |
| 12/0900 | Hurricane Watch changed to Hurricane
Warning | Florida Keys from the Dry Tortugas to the
Seven Mile Bridge and SW Florida from E Cape Sable to Bonita
Beach |
| 12/0900 | Tropical Storm Warning Issued | Florida Keys from Seven Mile Bridge to Ocean
Reef including Florida Bay nd on the mainland west of Ocean Reef to
E Cape Sable |
| 12/0900 | Hurricane Watch Issued | N of Bonita Beach to Tarpon Springs |
| 12/1500 | Hurricane Watch Issued | N of Tarpon Springs to Suwannee River
Florida |
| 12/1500 | Hurricane Watch changed to Hurricane
Warning | Cuban provinces
of Pinar Del Rio, La Habana, Ciudad de la Habana, Matanzas, and the
Isle of Youth |
| 12/1500 | Hurricane
Warning Discontinued | Jamaica |
| 12/2100 | Hurricane Watch changed to Hurricane
Warning | N of Bonita Beach FL to Bayport |
| 12/2100 | Tropical Storm Watch Issued | Jupiter Inlet FL north to Altamaha Sound
Georgia including Lake Okeechobee |
| 12/2100 | Hurricane Warning Discontinued | Cayman Islands |
| 13/0300 | Hurricane Watch changed to Hurricane
Warning | N of Bayport to the Suwannee River |
| 13/0300 | Tropical Storm Watch changed to Tropical Storm
Warning | Lake Okeechobee |
| 13/0300 | Tropical Storm Watch Issued | S of Jupiter Inlet FL to Ocean Reef and N of
Altamaha Sound to South Santee River South Carolina |
| 13/0900 | Hurricane Warning Issued | N of the Suwanne River to the Steinhatchee
River FL |
| 13/0900 | Tropical Storm Watch changed to Tropical Storm
Warning | Cocoa Beach FL to Altamaha Sound Georgia |
| 13/0900 | Tropical Storm Watch Issued | N of South Santee River SC to Cape Fear North
Carolina |
| 13/1100 | Hurricane Warning Discontinued | Cuban provinces
of Pinar Del Rio, La Habana, Ciudad de la Habana, Matanzas, and the
Isle of Youth |
| 13/1500 | Tropical Storm Watch Issued | North of Cape Fear NC to Oregon Inlet NC
including Pamlico Sound |
| 13/1500 | Hurricane Watch Issued | Flagler Beach FL northward to the Savannah
River near the GA/SC border |
| 13/1500 | Tropical Storm Watch changed to Tropical Storm
Warning | S of Cocoa Beach FL to Jupiter Inlet FL |
| 13/1800 | Tropical Storm Warning changed to Hurricane
Warning | Cocoa Beach FL to Altamaha Sound GA |
| 13/1800 | Tropical Storm Watch changed to Hurricane
Warning | N of Altamaha Sound GA to South Santee River
SC |
| 13/1800 | Tropical Storm Watch changed to Tropical Storm
Warning and Hurricane Watch | N of South Santee River SC to Cape Lookout
North Carolina |
| 13/2100 | Watches/Warnings Discontinued | S of Jupiter Inlet along the Florida E coast
to Ocean Reef and for all of the FL Keys |
| 13/2100 | Tropical Storm Warning and Hurricane Watch
changed to Hurricane Warning | N of South Santee River SC to Cape Lookout
North Carolina |
| 13/2100 | Tropical Storm Watch Issued | N of Oregon Inlet NC to Chincoteague Virgina
including Albemarle Sound and for Lower Chesapeake Bay South of
Smith Point |
| 14/0100 | Watches/Warnings Discontinued | All of the Florida West Coast |
| 14/0300 | Tropical Storm Warning Discontinued | Lake Okeechobee, FL |
| 14/0300 | Tropical Storm Watch changed to Hurricane
Warning | N of Cape Lookout NC to Oregon Inlet including
Pamlico and Albemarle Sounds |
| 14/0300 | Tropical Storm Watch changed to Tropical Storm
Warning | N of Oregon Inlet NC to Chincoteague VA
including Lower Chesapeake Bay South of Smith Point |
| 14/0600 | Tropical Storm Warning Discontinued | S of Cocoa Beach FL to Jupiter Inlet FL |
| 14/0900 | Tropical Storm Watch changed to Hurricane
Warning | N of Oregon Inlet NC to the N
Carolina/Virginia state border |
| 14/0900 | Tropical Storm Warning Issued | N of Chincoteague Virginia to Sandy Hook New
Jersey including Upper Chesapeake Bay, the Tidal Potomac and
Delaware Bay |
| 14/0900 | Tropical Storm Watch Issued | N of Sandy Hook NJ to the Merrimack River
Massachusetts including New York Harbor and Long Island Sound |
| 14/0900 | Hurricane Warning Discontinued | Altamaha Sound GA south to Cocoa Beach FL |
| 14/1500 | Hurricane Warning Discontinued | South of the South Santee River SC to Altamaha
Sound GA |
| 14/1500 | Tropical Storm Watch changed to Tropical Storm
Warning | N of Sandy Hook NJ to the Merrimack River MA
including New York Harbor and Long Island Sound |
| 14/1800 | Hurricane Warning changed to Tropical Storm
Warning | Little River Inlet South Carolina to the NC/VA
border |
| 14/1800 | Hurricane Warning Discontinued | S of Little River Inlet SC to South Santee
River SC |
| 14/2100 | Tropical Storm Warning Discontinued | S of Cape Lookout NC to Little River Inlet
SC |
| 15/0000 | Tropical Storm Warning Discontinued | S of Oregon Inlet NC to Cape Lookout NC
including Pamlico Sound and for Chesapeake Bay N of Smith Point
including the Tidal Potomac |
| 15/0300 | Tropical Storm Warning Discontinued | W of New Haven Connecticut to Oregon Inlet NC
and Long Island W of Fire Island |
| 15/1230 | Tropical Storm Warning Discontinued | W of Watch Hill Rhode Island and for Long
Island |
| 15/1500 | All Warnings Discontinued | |

Figure 1:
Best track
positions for Hurricane Charley, 9-14 August 2004.
Figure 2:
Selected wind
observations and best track maximum sustained surface wind speed
curve for Hurricane Charley, 9-14 August 2004. Aircraft
observations have been adjusted for elevation using 90% and 80%
reduction factors for observations from 700 mb and 850 mb,
respectively.

Figure 3:
Pressure
observations and minimum central pressure curve for Hurricane
Charley, 9-14 August 2004.
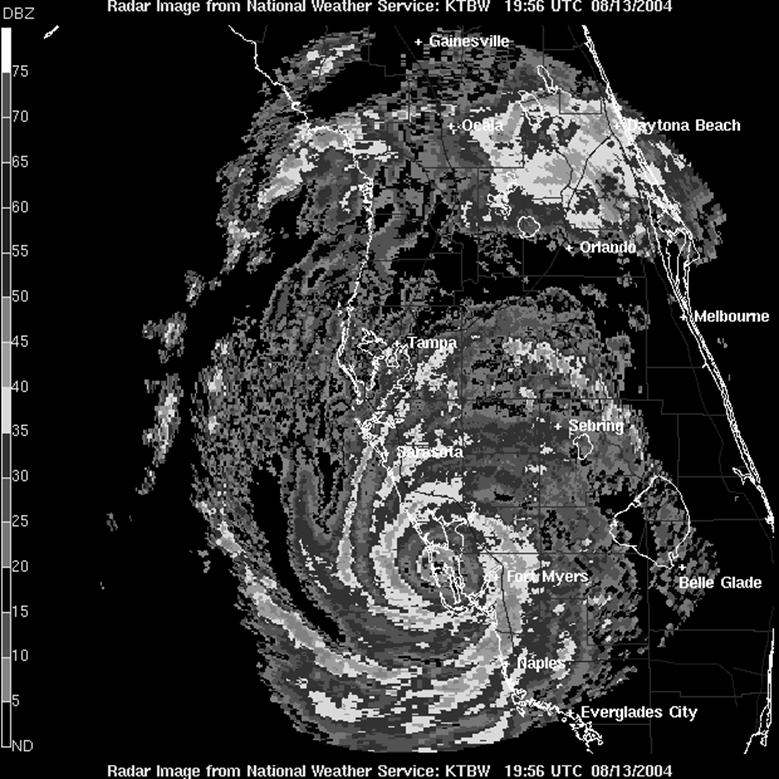
Figure 4:
Radar image of Hurricane Charley
from the Tampa Bay National Weather Service Forecast Office Doppler
Radar at 2056 UTC 13 August 2004.
|