 OND99 Quarterly Rpt. sidebar
|

(Quarterly
Report for Oct-Nov-Dec 1999)
1999 Gulf of
Alaska Biennial Groundfish Assessment Survey
The first in the new series of biennial bottom
trawl surveys of Gulf of Alaska (GOA) continental
shelf and slope groundfish resources was conducted
by the Resource Assessment and Conservation
Engineering (RACE) Division from 10 May through 28
July 28 1999. Prior to the 1999 survey, groundfish
resources in the GOA had been surveyed by the RACE
Division on a triennial schedule with surveys
conducted in 1984, 1987, 1990, 1993 and 1996. The
triennial surveys covered the continental shelf of
the GOA in each of the five previous surveys but
only included the continental slope in 1984 and
1987. Beginning in 1999, the biennial bottom
trawl survey effort in Alaska will alternate between
surveys of the GOA shelf and slope one year followed
by surveys of the Aleutian Islands shelf and Bering
Sea continental slope the next year. Bering
Sea shelf groundfish and crab resources will
continue to be surveyed on an annual basis. This
report summarizes the general sampling operations
and preliminary results of the 1999 GOA shelf and
slope bottom trawl survey.
Vessels and Gear
Survey sampling was conducted aboard the chartered
commercial trawlers Vesteraalen, Dominator,
and Morning Star. All three charter
vessels are house-forward trawlers with stern ramps,
multiple net storage reels (mounted forward of
the working deck and/or aft over the stern ramp),
telescoping deck cranes, propeller nozzles, and
paired, controlled-tension hydraulic trawl winches
with 1,280 m to 2,190 m of 2.54 cm diameter steel
cable. The Vesteraalen and Dominator
are both 38 m in overall length (LOA) and powered by
single, 1,700 and 2,000 continuous horsepower (HP)
main engines, respectively. The Morning
Star is 45 m LOA and propelled by a 1,700 HP
main engine.
The 75-day survey period from 10 May to 23 July was
divided into four legs of 18-19 days each. The Vesteraalen
charter period was extended an additional 5 days
from 24 July to 28 July to complete stations in the
eastern GOA. Sampling operations began near
the Islands of Four Mountains (long.170°W) and
extended eastward throughout the GOA on the
continental shelf and upper continental slope to
Dixon Entrance (long.132°30’W). Sampling
occurred at pre-selected stations, or nearby
alternate stations, in depths ranging from 16 m to
946 m (Figure 1).
The primary purpose of the biennial groundfish
surveys is to build a standardized time series of
data designed to assess, describe, and monitor the
distribution, abundance, and biological condition of
various GOA groundfish stocks. Specific
objectives of the 1999 survey were to:
-
Define the distribution and
relative abundance of the principal groundfish
and invertebrate species inhabiting the Gulf of
Alaska
-
Collect data to define various
species-specific biological parameters, i.e.,
age, sex, size, growth rates, length-weight
relationships, and feeding habits
-
Collect integrated net
configuration and position data for all trawl
hauls to obtain precise area-swept estimates
-
Record surface-to-bottom water
column temperatures
-
Perform special collections as
requested by cooperating research groups
Standard RACE
Division Poly-Nor’eastern high opening bottom
trawls, rigged with roller gear, were used
exclusively for sampling the selected survey
stations. Experimental sampling was conducted
with reinforced Poly-Nor’eastern nets equipped
with tire gear at sites previously found to be too
rugged for the standard roller gear trawl, however
these data were not used to estimate relative
abundance and biomass. Steel V-doors with
dimensions of 1.83 x 2.74 m, and weighing
approximately 800 kg each were used to open the net.
The GOA biennial survey area is dominated by the
continental shelf (depths to 200 m) which is crossed
by numerous gullies or troughs, some as deep as 300
m. The continental shelf represents
approximately 71% of the 319,884 km2 survey area
with associated gullies representing an additional
17%. The width of the shelf area varies from
approximately 18.5 km in the Unalaska Island-
Islands of Four Mountains region to 185 km off the
Kenai Peninsula (Figure
1). Irregular bathymetric features
along with an extensive and complex shoreline
region, provide a rich diversity of habitat types
for many juvenile and adult groundfish such as
walleye pollock (Theragra chalcogramma),
Pacific cod (Gadus macrocephalus), juvenile
sablefish (Anoplopoma fimbria), a wide
variety of flatfish species including Pacific
halibut (Hippoglossus stenolepis), rockfish
species such as Pacific ocean perch (Sebastes
alutus), and many invertebrates including
several commercial crab species, scallops, and
pandalid shrimp.
The continental slope (excluding major gullies)
between the depths of 200 m and 1,000 m represents
approximately 12% of the survey area. Often
steep and rugged, the slope region provides habitat
for species such as rougheye and shortraker
rockfishes (Sebastes aleutianus and S.
borealis), adult sablefish, shortspine
thornyheads (Sebastolobus alascanus), Dover
sole (Microstomus pacificus) and grenadiers
(Macrouridae).
Survey Design and Methods
As in past years, a stratified random survey
design was employed in the 1999 biennial survey.
The GOA survey region was divided into 59
strata based on bathymetry, major geographic
features, and International North Pacific Fisheries
Commission (INPFC) statistical areas. Strata
range from near-shore areas adjacent to coastlines
on the continental shelf to 1,000 m depths on the
upper continental slope.
A modified Neyman optimum allocation strategy based
on data from the 1990, 1993, and 1996 triennial
surveys was used to allocate effort between strata.
Neyman optimum allocation calculations were
made for each of the principal groundfish species in
each survey year based on that year’s survey data
and the estimated time to perform a tow in a given
stratum as the cost variable (deeper tows take
longer to execute, therefore cost more). A
mean of the resulting proportions was then
calculated, resulting in an estimate of optimal
allocation for each of the principal groundfish
species. A weighted mean of these values was
then calculated using each species’ mean biomass
as the weighting variable. Within each major
depth interval (1-100 m, 101-200 m, etc.), the
number of stations was then summed resulting in an
optimal allocation between depth intervals. This
number of tows was then reallocated between strata,
proportional to the area of each stratum so that the
sampling density was constant within each depth
interval throughout the survey area.
The target duration for on-bottom time for a
standard trawl haul was 15 minutes. Trawling
time on bottom was estimated during the tow using
real-time net configuration data (wingspread and
headrope height) acoustically transmitted to the
vessel. GPS data were collected every 2
seconds throughout the tow. Temperature and
depth were recorded every 6 seconds by a
bathythermograph attached to the trawl headrope.
A bottom contact device, based on a tilt
sensor attached to the fishing line to detect
contact with the bottom, collected data every 6
seconds. The final tow durations, start and
end times, and geographical positions were estimated
from all information collected from each tow.
Catches were sorted to species, weighed, and
enumerated according to standard AFSC and RACE
Division protocol. Extensive size composition data
were collected with barcode-based recording devices
and downloaded to computer database files after each
tow. A variety of biological data including
age structures (mostly otoliths), lengths, and
weights of individual specimens were collected and
entered in the computer database.
Results
Sampling proceeded from west to east. In
the Shumagin and Southeastern INPFC areas, an equal
number of stations from each stratum were randomly
assigned to each of the three vessels after
accounting for tows deeper than 700 m being sampled
exclusively by the Morning Star and stations
between 500 m and 700 m being sampled equally by the
Morning Star and Dominator. Stations
in the Chirikof, Kodiak, and Yakutat INPFC areas
were assigned to minimize the running time between
stations for each vessel. Some pre-assigned
stations were not sampled due to unsuitable bottom
conditions. In cases where trawlable bottom
could not be found at a given station, a preselected
alternate location was sampled. Of the 832
attempted standard survey tows, 764 tows were
successfully completed ranging in depth from 16 m to
946 m.
Sea surface temperatures and bathythermograph
recordings were collected at nearly every trawl
site. The average sea surface temperature for
the entire survey period was 8.0oC with
temperatures increasing from 4.1oC in
May, to 7.1oC in June and 11.5oC
in July. The mean bottom temperature for the survey
period was 5.1oC with temperatures
increasing from an average of 3.6oC in
May to 5.0oC in June and 5.8oC
in July. Bottom temperatures decreased with
increasing depth from 5.2oC at depths
shallower than 100 m to 3.2oC between 900
and 1,000 m of bottom depth.
Arrowtooth flounder (Atheresthes stomias),
Pacific ocean perch, Pacific halibut, walleye
pollock, giant grenadiers (Albatrossia pectoralis)
and Pacific cod, were the dominant species in trawl
catches representing nearly 70% of the 338,932 kg
total survey catch. Distribution and relative
abundance highlights for these major species
include:
-
Arrowtooth flounder, by far the
most abundant species in the survey, had an
estimated biomass of 1.3 million metric tons (t)
with 67% occurring in the cental GOA (Table
1). Arrowtooth flounder was the most
abundant species in the central and eastern GOA
and ranked second in the western GOA. Biomass
estimates for arrowtooth flounder have been
gradually declining from previous survey
estimates of 1.9 million t in 1990 and 1.6
million t in 1993, and 1996 (Table
2).
-
Pacific ocean perch was the
second most abundant species in the survey
ranking second in the central GOA behind
arrowtooth flounder. Eighty-four percent
of the 726,785 t biomass estimate was from the
the Central GOA with the remainder split between
the eastern (11%) and western (5%) GOA. The
1999 estimate was 6% lower than in 1996 but
still much higher than the 157,089 t and 483,491
t estimates of 1990 and 1993.
-
Walleye pollock was the third
most abundant species with 68% of the 632,763 t
biomass estimate coming from the western GOA.
Pollock abundance was sharply lower in the
central and eastern GOA representing only 25%
and 6%, respectively, of the total biomass.
Pollock abundance from the past four
surveys indicates a gradually declining biomass.
-
Pacific halibut was relatively
abundant throughout the entire survey, ranking
third in each of the three geographical areas.
Over 70% of the total biomass estimate of
582,856 t came from the central GOA. Biomass
estimates have risen from 328,092 t in 1990 to
approximately 575,000 t in 1993, 1996, and 1999.
-
Pacific cod was the sixth most
abundant species (behind giant grenadiers,
386,312 t) with 305,823 t of biomass. Nearly
57% of the biomass was from the Central GOA
followed by the Western GOA with 36%. The
Pacific cod biomass rose from 409,492 t in 1993
to 537,831 t in 1996 but showed a 43% decline in
1999.
-
Giant grenadiers, with 386,312 t
of total biomass, were the fifth most abundant
species in the survey area. Nearly the
entire grenadier biomass was contained between
500- and 1,000-m depths which had not been
sampled since the 1984 and 1987 surveys. Nearly
63% of the grenadier biomass was from the
central GOA followed by 28% from the western
GOA. Giant grenadiers with 386,312 t of total
biomass were the fifth most abundant species in
the survey area. Nearly the entire grenadier
biomass was contained between 500- and 1,000-m
depths that had not been sampled gulf-wide since
1987. The 1999 survey estimate was nearly three
times the 1987 estimate of 136,000 t.
Throughout the
survey, biological data were collected from a wide
variety of species with length measurements being
the most common. Nearly 219,000 fish
representing 74 species were measured for length
including approximately 56,000 arrowtooth flounder,
24,000 pollock, 18,000 shortspine thornyheads,
16,000 flathead sole, 13,000 Pacific ocean perch and
12,000 rex sole. Approximately 11,000 otoliths were
collected from 22 species along with 12,000
length-weight observations representing 39 species.
In addition, over 2,400 stomach samples were
collected from four major predator species:
arrowtooth flounder, Pacific cod, Pacific halibut,
and walleye pollock.
By Eric Brown.
Trawl Impact Studies in Eastern Bering Sea
The AFSC’s trawl impact project examines possible
adverse effects of bottom trawls on soft-bottom
benthos in the eastern Bering Sea. Earlier
studies revealed chronic effects on community
diversity and on individual macrofauna populations.
However, interpretation of these findings and
effective use for management purposes requires some
understanding of the underlying processes. To
address this need, a new multiyear study in the Crab
and Halibut Protection Zone 1 (also known as
management area 512) is being planned. Scheduled
to begin in summer 2000, it will investigate acute
effects and recovery from a single repetitive
trawling event. Detailed physical information
and historical trawl effort data have been assembled
to identify suitable experimental sites.
Epifauna and infauna data collected in
1996 and 1997 are being analyzed to identify
appropriate sample sizes for the research trawl
(epifauna) and benthic grab (infauna) sampling
efforts. Sidescan sonar, acoustic seabed
classification and subsampling of benthic grabs will
be used to characterize physical and chemical
effects (in collaboration with scientists at the
University of Alaska Fairbanks).
The before-after/control-impact (BACI) experimental
design involves repeated sampling of specific sites
to compare biotic and abiotic conditions before and
after trawling. This requires accurate
real-time positioning of sampling gear and the
commercial trawl used to impact the experimental
corridor. In May 1998, three ultra-short
baseline (USBL) systems were tested in a fixed short
baseline (SBL) tracking array maintained in Puget
Sound by the U.S. Navy Naval Undersea Warfare Center
Division Keyport. Using a chartered Bering Sea
trawler operating under representative study
conditions, this project demonstrated the
feasibility of real-time trawl positioning.
Comparison with Navy SBL fixes provided
estimates of USBL positioning error for two systems,
the Nautronix ATS II (3.7 m) and the ORE Trackpoint
II Plus (5.9 m). When all other sources of
error (e.g., errors due to GPS, the gyro and sound
velocity estimates) are considered, along-track
errors of 8.4 m and 10.6 m and cross-track errors of
11.6 m and 13.8 m, respectively, can be expected for
a trawl fishing in 60-65 m of water. An
over-the-side hydrophone pole suitable for chartered
fishing vessels was also developed and tested.
Complete details are available in “Report
and Analysis of Test Data from 1998 Trawl Position
Gear Trials in the Puget Sound Dabob Bay,
Washington” incorporating technical input from all
contractors and is available from Robert
McConnaughey.
By Robert McConnaughey.
Influence of Bottom Temperature on
Distribution and Abundance Estimates from EBS
Crab/Groundfish Bottom Trawl Survey
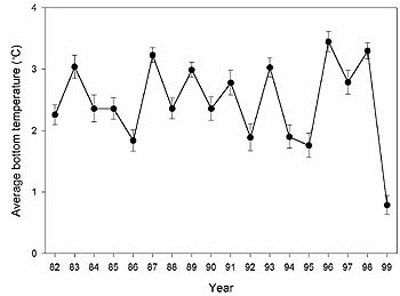
Figure 2.
Average bottom temperature among stations sampled in
the standard area of the AFSC eastern Bering Sea
crab/groundfish survey. High density stations,
those on the border of the 20 x 20 nautical mile
grid, were excluded. Error bars indicate 95%
confidence intervals.
Bottom temperatures
during the 1999 eastern Bering Sea crab/groundfish
bottom trawl survey were the coldest among these
surveys to date (Figure 2 above). Spring-summer
surveys in the eastern Bering Sea have been
conducted by the AFSC since 1975 and on an annual
basis since 1979. Although the survey in 1999
began approximately 2-weeks earlier than previous
years, the time difference did not account for the
extreme difference in bottom temperatures.
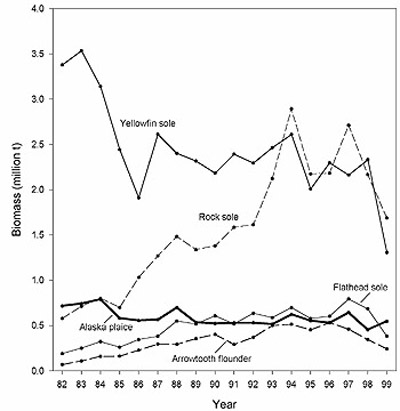
Figure 3.
Survey biomass estimates of major flatfish species
in the eastern Bering Sea from 1982 to 1999.
Distributions and
biomass estimates for many species examined during
the 1999 survey indicate a substantial deviation
from previous years. Decreases in biomass from
1998 estimates occurred for major flatfish species
such as yellowfin sole (44% decrease), rock sole
(22%), flathead sole (44%), and arrowtooth flounder
(29%) (Figure 3 above). The biomass estimate
for yellowfin sole was the lowest recorded since the
survey began using the standard 83-112 eastern
bottom trawl in 1982. Alaska plaice was the only
major flatfish species in which the estimated
biomass did not decrease from 1998 to 1999. The
decreased estimates of biomass among flatfish
species may in part be due to decreased catchability
owing to these species behavior to trawl gear in
colder temperatures. If flatfishes are less
active in colder than normal waters, the likelihood
for escapement under the footrope may increase and a
herding effect by the trawl warps may decrease.
In addition, for yellowfin sole, their
distribution in 1999 appeared closer to shore than
in previous years; catch per unit effort values in
1999 were higher among survey stations closest to
shore compared with previous years. Because
yellowfin sole migrate during spring to nearshore
spawning waters (< 30 m), some of which is
unavailable to the survey, a change in their
distribution may account for the decrease in
estimates of yellowfin sole biomass in 1999.
Biomass estimates for major roundfish species such
as walleye pollock and Pacific cod increased from
1998 to 1999. Walleye pollock estimates
increased from 2.21 to 3.57 million t, and estimates
for Pacific cod increased from 558,419 to 583,259 t.
While an increase in biomass estimates were
somewhat expected, their distributions during 1999
differed from previous years. In 1999,
walleye pollock were more concentrated to the
northwest area of the survey and appeared to avoid
the north central portion where a cold pool of less
than 0EC water was well developed. Walleye
pollock also had more westerly distributions during
other cold years (i.e., 1992, 1994, 1995) compared
with warmer years. Similarly, Pacific cod was
more concentrated to the west in 1999, with
relatively low concentrations in the inner part of
the survey (< 50 m bottom depth) compared with
previous years.
By Dan Nichol.
West Coast Upper Continental Slope Groundfish
Resources
The RACE West Coast Groundfish Team completed a
bottom trawl survey of the groundfish resources of
the West Coast upper continental slope (WCUCS)
between the U.S.-Canada border and Point Arguello
(lat. 34°50’N) in waters 183-1,280 m deep from 14
October to 19 November aboard the NOAA ship Miller
Freeman. This was the eleventh survey in an
ongoing series to monitor long-term trends in the
distribution and abundance of WCUCS groundfish
populations. Previous groundfish assessment
surveys of the West Coast upper continental slope
were conducted in 1984, from 1988 to 1993, and from
1995 to 1997. Two hundred seven (207) tows
were attempted during the 1999 survey. Out of
208 possible stations, 199 were sampled
successfully. Remaining attempted tows were
unsuccessful due to poor or uncertain gear
performance. Nine stations were abandoned
without any attempt because extensive acoustic
surveys of the sites revealed they were too rough or
steep for successful completion of a standardized
tow. Resource information from this survey
series is used to assess and manage several WCUCS
species including sablefish (Anoplopoma fimbria),
shortspine thornyhead (Sebastolobus alascanus),
longspine thornyhead (S. altivelis), and
Dover sole (Microstomus pacificus).
By Bob Lauth.
Up
|