|
Food secure—These households had
access, at all times, to enough food for an active, healthy
life for all household members.
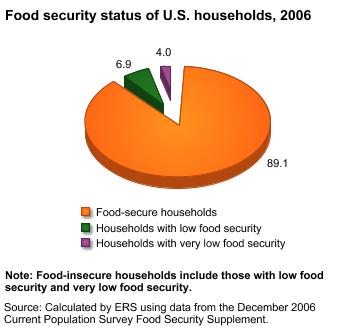
- 89.1 percent (103 million) of U.S. households were
food secure throughout 2006.
- Essentially unchanged from 89.0 percent in 2005.
Food insecure—At times during
the year, these households were uncertain of having, or
unable to acquire, enough food to meet the needs of all
their members because they had insufficient money or other
resources for food. Food-insecure households include those
with low food security and very low food
security.
- 10.9 percent (12.6 million) of U.S. households were
food insecure at some time during 2006
- Essentially unchanged from 11.0 in 2005.
Low food security—These food-insecure
households obtained enough food to avoid substantially
disrupting their eating patterns or reducing food intake,
by using a variety of coping strategies, such as eating
less varied diets, participating in Federal food assistance
programs, or getting emergency food from community food
pantries.
- 6.9 percent (8.0 million) of U.S. households had
low food security in 2006.
- Essentially unchanged from 7.1 percent in 2005.
Very low food security—In these
food-insecure households, normal eating patterns of one
or more household members were disrupted and food intake
was reduced at times during the year because they had
insufficient money or other resources for food. In previous
reports, these households were described as "food
insecure with hunger." For a description of the change
in food security labels, see "Hunger and Food Security."
- 4.0 percent (4.6 million) of U.S. households had
very low food security at some time during 2006.
- Essentially unchanged from 3.9 percent in 2005.
How Many People Lived in Food-Insecure Households?
- In 2006, 35.5 million people lived in food-insecure
households, including 12.6 million children.
- Of these individuals, 7.7 million adults and 3.4
million children lived in households with very low food
security.
- Children’s food security is affected to some
extent in most food-insecure households (see the ERS
report, Food
Assistance Research Brief—Food Insecurity in Households With Children). However, children
are usually protected from substantial reductions in
food intake even in households with very low food security.
In 2006, 430,000 children (0.6 percent of the Nation’s
children) lived in households with very low food security
among children.
For more information, see how
often food-insecure households were food insecure.
Food Insecurity by Household Type
The prevalence of food insecurity varied considerably
among household types. Some groups with rates of food
insecurity much higher than the national average (10.9
percent) are:
- Households with incomes below the official poverty
line—$20,444 for a family of four in 2006 (36.3
percent)
- Households with children, headed by a single woman
(30.4 percent)
- Black households (21.8 percent)
- Hispanic households (19.5 percent).
Download
an excel file with these data.
- Overall, households with children had nearly twice
the rate of food insecurity (15.6 percent) as those without children
(8.5 percent). Among households with children,
married-couple families had the lowest rate of food
insecurity (10.1 percent).
- The prevalence of food insecurity for households
located in principal cities of metropolitan areas (13.2
percent) and nonmetro areas (12.0 percent) exceeded
that of households in suburbs and other metropolitan
areas outside central cities (9.0 percent).
- Regionally, the food insecurity rate was above the
national rate in the South (12.3 percent) and below
the national rate in the Northeast (9.2 percent).
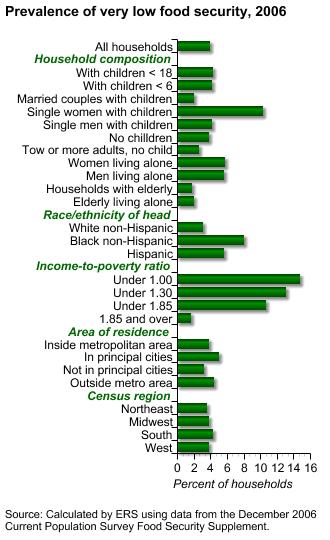
Very Low Food Security by Household Type
The prevalence of very low food security in various types
of households followed a pattern similar to that observed
for food insecurity overall. Prevalence rates were lowest
for:
- Married couples with children (2.1 percent)
- Multiple-adult households with no children (2.6 percent)
- Households with elderly people (1.8 percent).
Prevalence rates of very low food security were higher
than the 4.0-percent national average for:
- Families with children, headed by single women (10.3 percent)
- Black households (8.0 percent)
- Hispanic households (5.7 percent)
- Households with incomes below the poverty line (14.8
percent)
- Households in principal cities of metropolitan areas
(5.0 percent)
- Households in the South (4.3 percent).
Download
an excel file with these data.
Recent Trends
The prevalence of food insecurity declined from 11.9
percent of households in 2004 to 11.0 percent in 2005 and remained essentially unhanged at 10.9 percent in 2006.
The prevalence of very low food security in 2006 (4.0 percent) was essentially unchanged from 2004 and 2005 (3.9 percent in both years). The year-to-year deviations
from a consistent downward trend between 1995 and 2000 include
a substantial 2-year cycle that is believed to result
from seasonal effects on food security prevalence
rates. The CPS food security surveys over this period
were conducted in April in odd-numbered years and August
or September in even-numbered years. Measured prevalence
of food insecurity was higher in the August/September
collections, suggesting a seasonal-response effect. In
2001 and later years, the surveys were conducted in early
December, which avoids seasonality effects in interpreting
annual changes.
Geographic Distribution of Food Insecurity
Prevalence rates of food insecurity varied considerably
from State to State. Data for 3 years, 2004-06, were combined
to provide more reliable statistics at the State level.
Measured prevalence rates of food insecurity during this
3-year period ranged from 6.4 percent in North Dakota
to 18.1 percent in Mississippi; measured prevalence rates
of very low food security ranged from 2.1 percent in New Jersey
to 6.4 percent in Mississippi.
Source: Calculated
by ERS based on Current Population Survey Food Security
Supplement data.
This chapter is based on the publication Household
Food Security in the United States, 2006.
|