|

Latino Population: Demographic InformationPOPULATION DENSITYLatinos are the second largest minority population in the United States, totaling approximately 22.4 million people, or about 9 percent of the total U.S. population of about 250 million (U.S. Bureau of the Census, 1993b). Between 1980 and 1990, the Latino population increased by 53 percent. This rate of growth is more than five times that of the total U.S. population (9.5 percent) and about eight times that of non-Latinos (6.6 percent). About half of this growth is attributed to the natural increase in the population, and the other half is the result of immigration (U.S. Bureau of the Census, 1993b). It is estimated that by the year 2000 Latinos will become the largest minority group in the Nation and that by the year 2050 they will represent about 20 percent of the total U.S. population (National Council of La Raza, 1992).
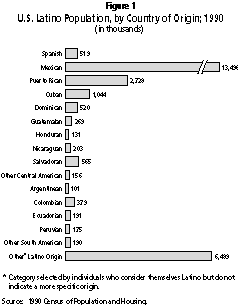
COMPOSITION AND DISTRIBUTIONLatinos are a culturally, demographically, and geographically diverse population. According to the 1990 census, persons of Mexican origin form the largest Latino population group in the United States, numbering more than 13 million persons, followed by Puerto Ricans, who number close to 3 million, and Cuban-Americans, numbering slightly more than 1 million (figure 1). In 1990, more than half of Latinos (64.2 percent) were native-born Americans and nearly three-quarters were either native-born or naturalized citizens (U.S. Bureau of the Census, 1993b).
AGELatinos are a young population. Current Population Survey data for 1993 show that nearly 66 percent of Latinos are younger than age 35. The median age for Latinos in the United States is 26.7 years--about 8 years less than the median age of 34.4 years for non-Latinos (U.S. Bureau of the Census, 1993a).Among the three largest Latino groups, Cuban-Americans are the oldest, with a median age of 43.6 years; Mexican-Americans are the youngest, with a median age of 24.6 years; and Puerto Ricans fall in between, with a median age of 26.9 years. A growing segment of the Latino population, Central Americans and South Americans, reported a median age of 28.6 years (U.S. Bureau of the Census, 1993a).
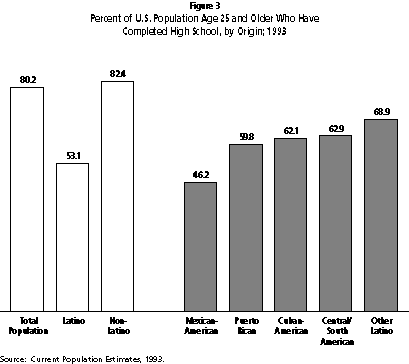
EDUCATIONOverall, educational attainment is lower for Latinos than for non-Latinos. In the United States, a little more than half of Latinos age 25 and older have a high school education; approximately 12 percent have a fifth-grade education or less; and 9 percent have a bachelor's degree or education above that level. Among non-Latinos, more than 80 percent have completed high school, slightly more than 1 percent have a fifth-grade education or less, and nearly 23 percent have a bachelor's degree or education above that level (U.S. Bureau of the Census, 1993a)The diversity among Latino population groups also extends to educational attainment. In the United States, 46.2 percent of Americans, 59.8 percent of Puerto Ricans, 62.1 percent of Cuban-Americans, and 62.9 percent of Central Americans and South Americans have graduated from high school. Among those who classify themselves as "other Latino," 68.9 percent are high school graduates (figure 3).
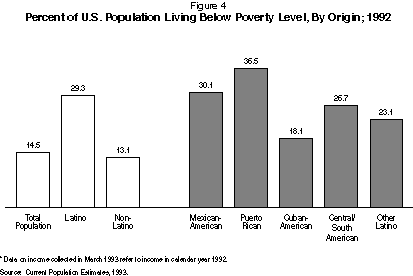
INCOME AND EMPLOYMENTIn 1992, 29.3 percent of Latino households lived below the poverty level, compared with 13.1 percent of non-Latino households. The percent of Latino families living in poverty varies according to country of origin. Puerto Ricans have the highest percent (36.5 percent) of families living below the poverty level, followed by Mexican-Americans (30.1 percent), Central Americans and South Americans (26.7 percent), and Cuban-Americans (18.1 percent), as shown in figure 4.
LANGUAGEAccording to the 1990 census, about 78 percent of Latinos over the age of 5 speak a language other than English in the home. This language is almost always Spanish. About 49 percent of Latinos reported that they speak English very well, about 14 percent said they speak English well, and about 37 percent said that they speak English poorly or not at all (U.S. Bureau of the Census, 1993b).
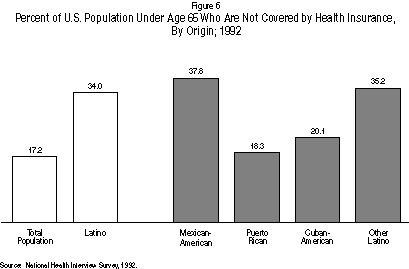
HEALTH CARE COVERAGELatinos are more likely to be uninsured than other Americans. In 1992, slightly more than one-third did not have health insurance (figure 6). A contributing factor is that programs such as Medicaid offer limited coverage to the unemployed but not to the working poor. Consequently, Latinos have less access to preventive and primary health care. Conditions that can be prevented or controlled in a doctor's office often are not addressed and can lead to costly hospitalizations.
REFERENCESNational Council of La Raza. State of Hispanic America 1991: An Overview. Washington, DC: National Council of La Raza, 1992.U.S. Bureau of the Census. Current population reports, Series P20-475. Hispanic Population in the United States: March 1993. Washington, DC: U.S. Government Printing Office, 1993a. U.S. Bureau of the Census. Selected Social Characteristics: 1990, United States. 1990 Census of Population and Housing (CPH-L-80). Washington, DC: U.S. Bureau of the Census, 1991. U.S. Bureau of the Census. We the American... Hispanics. November 1993. Washington, DC: U.S. Government Printing Office, 1993b. Latino Resources
Home | Public Information |