Hurricane Lenny was the fifth category-four hurricane on the Saffir/Simpson
Hurricane Scale (SSHS) of the 1999 season - a record. This hurricane had a
major impact on numerous land areas in the Caribbean Sea. Moreover, Lenny
was the first storm to have an extended west-to-east track across the
central and eastern Caribbean Sea in the 113-year Atlantic tropical
cyclone record.
a. Synoptic History
A broad area of low pressure was first identified in the southwest
Caribbean Sea early on 8 November. Later that day, there was sufficient
convective banding to warrant a T1.0 Dvorak satellite-based intensity
classification from the Tropical Analysis and Forecast Branch (TAFB) at
TPC. Although thunderstorm activity associated with the low remained poorly
organized, locally heavy rains and strong gusty winds occurred over the
northwest Caribbean Sea and adjacent portions of Central America and Mexico
for several days. On 12 November, a U.S. Air Force Reserve (USAFR)
Hurricane Hunter aircraft investigated the disturbance but failed to find a
well-defined surface circulation center. Early on the 13th,
satellite imagery showed that the system was gradually becoming better
organized. Later that afternoon the Hurricane Hunters found 30 knot surface
winds and a 1003 mb central pressure. Tropical Depression Sixteen formed
about 150 n mi south of the Cayman Islands at 1800 UTC 13 November (This is
when the best track begins in Table 1 and
Figure 1). By mid morning of the
14th, the overall organization of the depression was improving
and the depression was estimated to have become Tropical Storm Lenny at
1200 UTC 14 November.
A USAFR reconnaissance mission the afternoon of the 14th found
maximum flight-level (1500 ft) winds of 84 knots and a central pressure of
988 mb. Lenny became a hurricane at 0000 UTC 15 September while centered
about 150 miles southwest of Kingston, Jamaica. DMSP SSM/I imagery near
this time showed a banding-type eye 15-20 n mi in diameter. During the
next 12 hours, the central pressure fell 10 mb and Lenny strengthened to a
85-knot, category two hurricane on the SSHS.
By the evening of the 15th, the eye was no longer discernible
in satellite imagery, the overall cloud pattern became less organized, and
Lenny weakened to 75 knots - see Figure 2(a).
One of the most interesting aspects of Lenny was its extended west-to-east
motion through the Caribbean, unprecedented in the 113-year Atlantic basin
tropical cyclone record. For its first 48 hours, Lenny moved on a east to
east-southeast course. This motion was induced by the flow around the
southern portion of a deep-layer trough located over the western Atlantic.
Several shortwave troughs helped to amplify the mean western Atlantic
trough through the period which increased the westerly steering flow. From
1200 UTC 15 November to 1800 UTC 16 November, Lenny's mean forward motion
was 14 knots.
The weakening on the 15th was temporary and Lenny re-intensified
early on the 16th. During a 24 hour period beginning about midday on the
16th, the central pressure dropped 34 mb. Lenny's maximum
sustained surface winds of 135 knots and minimum central pressure (933 mb)
occurred at 1800 UTC 17 November when the hurricane was centered about 18 n
mi south of St. Croix in the U.S. Virgin Islands. However, the 135-knot
winds were confined to the southeast quadrant of the hurricane and these
strongest wind speeds did not occur over land.
Lenny moved into a col point between two mid-level ridges late on the
17th and its forward motion slowed. The hurricane drifted
east-northeastward before turning southeastward early on the
19th. Despite what appeared in satellite imagery as a favorable
upper-level outflow pattern, Lenny weakened, perhaps due to upwelling.
Lenny was gradually weakening when its center passed very slowly over
St. Maarten during the afternoon of the 18th, Anguilla later that
evening, and St. Barthelemy early on the 19th. Lenny weakened to a
tropical storm on the 19th just south of St. Barthelemy.
The storm made its final landfall in Antigua late on the 19th.
Lenny continued to move southeastward and the forward motion increased to
near 8 knots. The motion turned again toward the northeast as Lenny
weakened to a depression at 0000 UTC 21 November. The depression
turned back to the east early on the 21st and Lenny dissipated on
the morning of the 23rd about 600 n mi east of the leeward islands.
b. Meteorological Statistics
The best-track intensities in Table 1 were obtained from the data in
Figure 3(a) and Figure 4
which depict the curves of maximum sustained one-minute average "surface"
(10 meters above ground level) wind speed and minimum central sea-level
pressure, respectively, as a function of time. These figures also contain
data upon which the curves are based: USAFR and NOAA aircraft
reconnaissance flight level wind speeds and GPS dropsonde data, intensity
estimates from surface synoptic data, and satellite-based Dvorak-technique
intensity estimates from the Tropical Analysis and Forecast Branch (TAFB),
the Satellite Analysis Branch (SAB), and the U.S. Air Force Weather Agency
(AFWA). The flight-level wind data in Figure 3a
and Figure 3b have been adjusted
for elevation (90% of 700 mb wind speeds, 80% of 850 mb wind speeds, and
85% of 1500 ft speeds). Dropsonde wind speed measurements that terminate
above the 10 meter level are adjusted to 10 meters using a mean hurricane
eyewall profile determined by previous dropsonde measurements. For
clarity, Figure 3(b) shows only the aircraft flight
level and dropsonde data
1. Wind and Pressure Data
The majority of the aerial reconnaissance flights into Lenny were done by
the USAFR "Hurricane Hunters". The Hurricane Hunters flew 17
reconnaissance missions, and made 46 center fixes while NOAA aircraft
performed two missions contributing four center fixes. Lenny also featured
the first utilization of the new USAFR WC130-J model aircraft for
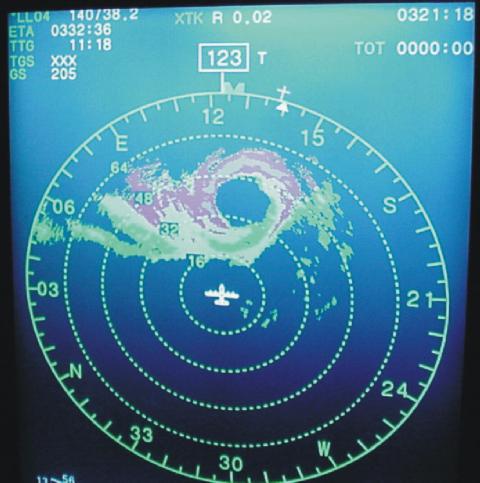
reconnaissance. Figure 5 is a radar image from the new
J model at 0321 UTC 18 November right before it penetrated the eye for a
fix.
The peak intensity of Lenny, 135 knots, is based on 90% of the 149 knot
flight-level (700 mb) wind speed reported at 1702 UTC 17 November. The GPS
dropsonde from this fix operationally measured 180 knots at 891 mb.
Post-flight processing corrected this value to 183 knots, a record
dropsonde wind speed in a hurricane. Figure 6 shows
the eyewall dropsonde wind profile at 1940 UTC 17 November; the 10-meter
wind was 125 kt. The lowest pressure recorded by the aircraft was 934 mb
at 1929 UTC 17 November. However, the minimum central pressure of 933 mb
was assigned based on the lower 700 mb height on the 1702 UTC fix. The 929
mb pressure from the 2134 UTC fix was an extrapolated value and has been
discounted.
Table 2 lists a selection of surface observations
from land stations. The highest official sustained surface wind speed
(gust) observed over land was 73 knots (90 knots) at the St. Maarten
Meteorological Office in Phillpsburg at 0200 UTC 19 November. However, the
meteorological antenna fell down during the strongest winds. Hamilton
Airport on St. Croix recorded sustained 1-minute winds of 60 knots, with a
gust to 80 knots, at 1933 UTC 17 November. The lowest official pressure
observed in the northern Leeward Islands was 972.1 mb at the St. Maarten
Meteorological Office at 0200 UTC 19 November. Table 3
lists ship reports of 34 knot winds or higher associated with Lenny.
Table 4 lists selected amateur radio weather reports.
The maximum sustained surface wind speed reported via amateur radio
operators was 81 knots on St. John in the U.S. Virgin Islands at 1900 UTC
17 November. During the peak of the hurricane, Saba recorded a gust of 145
knots (2600 ft elevation) before the anemometer blew away. The highest
measured gust on St. Croix was 97 knots at 2000 UTC 17 November, two hours
after Lenny reached its peak intensity. This gust measurement coincides
with Lenny's closest approach to the island. The minimum central pressure
at St. Croix, 980 mb, was also recorded at this time.
2. Rainfall Data
Lenny's slow drift across the northern Leeward Islands for a 36-hour period
resulted in some very high rainfall amounts. For many locations heavy
rains over several days was the primary impact of Lenny. Portions of
French St. Martin, St. Barthelemy, and Guadeloupe received record rains.
The highest reported storm-total rainfall was 34.12 inches on St. Martin at
Gendarmerie. This included a 24-hour record of 18.98 inches on the 18
November. St. Martin Marigot D.D.E. recorded 26.10 inches. Of this total,
a record 22.64 inches fell in a 24-hour period beginning around midday on
the 17th. Rainfall totals on St. Barthelemy were about 15 inches
while 6 to 12 inch totals were typical on Guadeloupe. The highest rainfall
total in Dutch St. Maarten was 27.56 inches recorded at the meteorological
office in Phillpsburg resulting in mud slides in the area. V.C. Bird
International Airport in Antigua reported 18.32 inches in association with
Lenny. A little over 25 inches was recorded in the southern portion of the
island. There were reports of mud slides from St. Kitts.
Rainfall totals averaged 3 to 4 inches across the U.S. and British Virgin
Islands. Hamilton Airport in St. Croix measured 8.05 inches of rain,
resulting in widespread flooding around the island inundating many homes.
The highest official rainfall total in Puerto Rico was 9.39 inches on
Magueyes Island, Lajas. Co-op observer rainfall totals across Puerto Rico
averaged 4 to 8 inches with the highest value, 12.39 inches, reported in
Toro Negro Orocovis. Landslides and mud slides were reported in interior
and west sections of Puerto Rico.
3. Storm Surge/Tide Data
Fredericksted in St. Croix was inundated by an estimated 15 to 20 ft storm
surge. However, a complete storm surge survey has not been completed at
this time. The maximum recorded storm tide was 2.9 feet at the NOAA
National Ocean Service (NOS) gage in Lime Tree Bay on St. Croix. NOAA NOS
gages recorded 1.8 feet on St. Thomas and in Puerto Rico (San Juan). There
was also considerable coastal erosion reported on St. Croix.
Lenny's approach from the west produced unprecedented wave and storm surge
impact on westward-facing coasts and harbors. The meteorological service
in Dutch St. Maarten reported that southern and western coastal areas were
significantly impacted by wave action. The Metro-France meteorological
station in Gustavia on St. Barthelemy estimated waves of up to 16 feet in
the harbor on 17 November. A platform near La Desirade, just east of
Grande-Terre Guadeloupe, recorded a significant wave height of 9.8 ft at
2300 UTC 20 November. Estimates range up to 13 ft in the harbor.
Lenny generated large waves and swells that propagated across much of the
southern and eastern Caribbean, affecting the Guajira Peninsula of
Colombia, Aruba, Bonaire, Curacao, and much of the remainder of the Leeward
and Windward Islands.
c. Casualty and Damage Statistics
There were 17 deaths directly associated with Lenny, 3 in Dutch St. Maarten,
2 in Colombia, 5 in Guadeloupe, 1 in Martinique, and 6 offshore. Two of the
deaths in St. Maarten were caused by flying debris while the other was the
result of a collapsed roadway. The remainder of the onshore fatalities,
based on media reports, are presumed to be due to freshwater flooding. Two
of the offshore deaths occurred when the sailing yacht VIDAR was lost
somewhere in the southern Caribbean Sea.
Lenny produced considerable damage on many of the islands in the northeast
Caribbean due to the heavy rains and unprecedented wave and storm surge
action. St. Croix sustained moderate damage. Many boats were washed ashore
along the north coast of the island. In Christiansted Harbor, several boats
sunk and south and east portions of the island suffered roof damage. Lenny
also impacted the agricultural areas of the island. Both the Dutch and
French portions of St. Maarten/Martin were severely impacted with many
buildings damaged and boats damaged or lost. In St. Lucia, at least 70
homes were reported damaged. In Saba, the airport tower and several other
buildings were severely damaged. Guadeloupe sustained a large amount of
damage along the west coast due to the wave action and inland due to heavy
rains.
In Grenada, ten homes were destroyed and 21 small boats were lost. There
were also reports of damage St. Vincent and the Grenadines, and Montserrat.
Insured losses of 165 million U.S. dollars have been reported from Puerto
Rico and the U.S. Virgin Islands. Using a factor of 2.0, the total U.S.
damages from Lenny is estimated at 330 million dollars.
d. Forecast and Warning Critique
With guidance from global models, the incipient disturbance that was to
become Lenny was first identified as a candidate for development in NHC's
Tropical Weather Outlook about five days before it became a tropical
depression.
The official track forecast errors for Lenny, along with those of the
various objective techniques, are listed in Table 5.
With the exception of the 12 hour time period, the errors for Lenny were 5%
(24 h) to 33% (72 h) above the most recent ten-year averages. Lenny's
unique track likely contributed to the larger-than-normal track errors. In
contrast to the official forecast errors, the UKM 24 h, 36 h, 48 h, and 72
h track forecast errors were below the most recent ten-year averages. The
UKMI errors were 12% (24 h) to 40% (72 h) below the official forecast.
Most of the remaining objective guidance forecast errors were above the
official forecast at all time periods.
An examination of the official intensity forecasts for Lenny show that the
strengthening of Lenny was under-forecast prior to its peak intensity and
over-forecast thereafter. Intensity forecasts errors were as large as 35
to 45 knots at 24 to 36 hours and 60 to 75 knots in 48 to 72 hours. These
errors are not surprising given the unusual strength of Lenny. Meanwhile,
the official forecasts were as much as 40 to 45 knots too high 24 to 36
hours after the peak intensity was reached. The Statistical Hurricane
Intensity Prediction Scheme (SHIPS), typically the best intensity guidance,
under-forecast Lenny's peak intensity by 41 to 51 knots at 24 to 36 hours.
Table 6 lists the various watches and warnings that
were issued for Lenny. Hurricane warnings were posted for the U.S. Virgin
Islands about 36 hours before the onset of hurricane-force winds. Similar
lead times were provided to the northern Leeward Islands.
Acknowledgments:
The author appreciates the information provided by the San Juan NWFO,
Patrick Jeremiah Director, Meteorological Services Antigua, Roland Mazurie
of Metro-France/Service Regional de Guadeloupe, and Ashford James of the
Meteorological Service Netherlands Antilles/St. Maarten. James Franklin
supplied the wind and pressure plots. Mike Tichacek helped translate the
storm report from Metro-France/Service Regional de Guadeloupe.
(The Metro-France Service Regional de Guadeloupe report on Lenny can be
accessed from the Metro-France Web Site
http://www.meteo.gp/webAG/cyclone/cyclone.htm)

Figure 1.
Best track positions for Hurricane Lenny, 13-23 November 1999.

Figure 2.
Sequence of SSM/I microwave images of Hurricane Lenny showing the evolution
of inner-core region over a 48 hour period from (A) a 75-knot hurricane to
(B) a 100-knot hurricane to (C)a 130-knot category four hurricane (about six
hours after peak intensity).

Figure 3a.
Best track maximum sustained 1-minute 10 meter wind speed curve for
Hurricane Lenny, 13 - 23 November 1999, showing all available intensity
estimates and wind observations (aircraft observations adjusted for
elevation (90% of 700 mb wind speeds, 80% of 850 mb speeds, and 85% of 1500
ft speeds).

Figure 3b.
Best track maximum sustained 1-minute 10 meter wind speedcurve for Hurricane
Lenny, 13 - 23 November 1999, showing in situ wind observations adjusted for
elevation (90% of 700 mb wind speeds, 80% of 850 mb speeds, and 85% of 1500
ft speeds.

Figure 4.
Best track minimum central pressure curve and central pressure observations
or estimates for Hurricane Lenny, 13-23 November 1999.

Figure 5.
Radar image from the new U.S. Air Force Reserve Hurricane Hunter WC-130J
aircraft at 0321 UTC 18 November 1999. The aircraft penetrated the eye at
0332 UTC and reported flight-level (700 mb) winds of 119 knots and a central
pressure of 944 mb.
Figure 6.
Hurricane Lenny eyewall GPS dropsonde wind profile near peak intensity, 1940
UTC 17 November 1999.
Table 1.
Preliminary Best Track - Hurricane Lenny, 13 - 23 November 1999.
Date/Time
(UTC) |
Position |
Pressure
(mb) |
Wind Speed
(kt) |
Stage |
| Lat. (°N) |
Lon. (°W) |
| 13/1800 | 16.7 | 81.6 | 1003 | 30 | Tropical Depression |
| 14/0000 | 16.5 | 81.1 | 1003 | 30 | " |
| 14/0600 | 16.4 | 80.5 | 1002 | 30 | " |
| 14/1200 | 16.4 | 79.9 | 1000 | 40 | Tropical Storm |
| 14/1800 | 16.3 | 79.3 | 992 | 55 | " |
| 15/0000 | 16.0 | 78.6 | 988 | 70 | Hurricane |
| 15/0600 | 15.5 | 77.7 | 977 | 75 | " |
| 15/1200 | 15.1 | 76.4 | 971 | 85 | " |
| 15/1800 | 14.8 | 74.8 | 983 | 75 | " |
| 16/0000 | 15.0 | 73.4 | 982 | 75 | " |
| 16/0600 | 15.1 | 72.0 | 974 | 75 | " |
| 16/1200 | 15.1 | 70.5 | 971 | 85 | " |
| 16/1800 | 15.4 | 69.0 | 967 | 85 | " |
| 17/0000 | 15.9 | 67.6 | 959 | 100 | " |
| 17/0600 | 16.4 | 66.5 | 952 | 105 | " |
| 17/1200 | 16.8 | 65.5 | 946 | 115 | " |
| 17/1800 | 17.4 | 64.8 | 933 | 135 | " |
| 18/0000 | 17.6 | 64.2 | 940 | 130 | " |
| 18/0600 | 17.8 | 63.9 | 944 | 125 | " |
| 18/1200 | 17.9 | 63.6 | 953 | 120 | " |
| 18/1800 | 18.0 | 63.3 | 966 | 110 | " |
| 19/0000 | 18.1 | 63.1 | 972 | 85 | " |
| 19/0600 | 18.0 | 62.9 | 979 | 75 | " |
| 19/1200 | 17.9 | 62.8 | 986 | 70 | Hurricane |
| 19/1800 | 17.6 | 62.5 | 994 | 60 | Tropical Storm |
| 20/0000 | 17.3 | 61.8 | 994 | 55 | " |
| 20/0600 | 17.0 | 61.1 | 995 | 55 | " |
| 20/1200 | 16.5 | 60.4 | 996 | 50 | " |
| 20/1800 | 15.9 | 59.8 | 998 | 45 | " |
| 21/0000 | 16.0 | 59.0 | 998 | 40 | " |
| 21/0000 | 16.5 | 58.1 | 998 | 30 | Tropical Depression |
| 21/1200 | 17.2 | 57.1 | 999 | 30 | " |
| 21/1800 | 18.0 | 56.7 | 1000 | 25 | " |
| 22/0000 | 18.4 | 56.1 | 1001 | 25 | " |
| 22/0600 | 18.5 | 55.7 | 1002 | 25 | " |
| 22/1200 | 18.5 | 55.3 | 1004 | 25 | " |
| 22/1800 | 18.5 | 54.7 | 1005 | 20 | " |
| 23/0000 | 18.5 | 53.8 | 1006 | 20 | " |
| 23/0600 | 18.5 | 52.8 | 1006 | 20 | " |
| 23/1200 | | | | | Dissipated |
| |
| 17/1800 | 17.4 | 64.8 | 933 | 135 | Minimum Pressure |
| Landfalls |
| 17/1800 | 17.4 | 64.8 | 933 | 135 | St. Croix USVI |
| 18/1800 | 18.0 | 63.3 | 966 | 110 | St. Martin |
| 19/0000 | 18.1 | 63.1 | 975 | 85 | Anguilla |
| 19/0600 | 18.0 | 62.9 | 979 | 75 | St. Barthelemy |
| 20/0000 | 17.3 | 61.8 | 994 | 55 | Antigua |
Table 2. Hurricane Lenny selected surface observations, November 1999.
| |
Minimum
sea-level
pressure |
Maximum surface wind speed
(kt) |
|
| Location |
Pressure
(mb) |
Date/time
(UTC) |
Sustained
winda
(kts) |
Peak
gust (kts) |
Date/timeb
(UTC) |
Storm
surgec
(ft) |
Storm
tided
(ft) |
Rain
(storm total)
(in) |
| St. Maarten |
| Met. Office (Roof) - Phillpsburg | 972.1 | 19/0200 | 73 | 90 | 19/1730 | | | 18.65 |
| Met. Office FMC8 Auto. Rain Gauge | | | | | | | | 27.56 |
| Antigua |
| V.C. Bird International Airport | 994.5 | 20/0100 | 35 | 50 | 19/2046 | | | 18.32 |
| English Harbour | | | | 69 | 19/XXXX | | | |
| U.S. Virgin Islands |
| St. Croix |
| Hamilton Airport | 981.7 | 17/1933 | 60 | 80 | 17/2035 | | | 8.05 |
| Maria Hill@ | 969.9 | 17/2010 | 72 | 97 | 17/1836 | | | |
| USDA MET STN Frederk | | | | | | | | 2.78 |
| Lime Tree Bay/NOAA NOS Gage | | | | | | | 2.9 | |
| St. Thomas |
| Cyril E. King Airport | 993.2 | 17/1654 | 46 | 61 | 18/0417 | | | 4.34 |
| USGS/Bonne Resolution GUT | | | | | | | | 2.01 |
| USGS/National Park Service | | | | | | | | 3.44 |
| Charlotte Amalie/NOAA NOS Gage | | | | | | | 1.8 | |
| St. John |
| Health Center/NWS Sensor #F420C | | | | 80 | 17/XXXX | | | |
| USGS/Met Stn Lind Point | | | | | | | | 2.95 |
| Coral Bay/CO-OP Observer | 986.7 | 17/1900 | | 65 | 17/1710 | | | 2.40 |
| Puerto Rico |
| Luis Munoz Marin Intl. Airport (TJSU) | 1000.0 | 17/0914 | 29 | 34 | 17/1423 | | | 2.51 |
| La Puntilla,San Juan/NOAA NOS Gage | | | | | | | 1.8 | |
| Ceiba/Roosevelt Roads NS (TJNR) | 1001.0 | 17/1355 | 29 | 42 | 17/1345 | | | 4.25 |
| Magueyes Isl., Lajas/NOAA NOS Gage | | | | | | | 1.1 | 9.39 |
| NWS CO-OP Observer Rainfall |
| Toro Negro Orocovis | | | | | | | | 12.39 |
| Pico Del Este | | | | | | | | 11.75 |
| Jayuya | | | | | | | | 11.41 |
| Rio De La Plata | | | | | | | | 10.51 |
| Aibonito | | | | | | | | 9.90 |
| Villalba 3NE | | | | | | | | 8.46 |
| Rio Blanco Naguabo | | | | | | | | 7.95 |
| Maunabo | | | | | | | | 7.45 |
| Rio Orocovis | | | | | | | | 6.97 |
| Gurabo AG EXP STN | | | | | | | | 6.71 |
| Cayey 1E | | | | | | | | 6.61 |
| Lago De Matrullas | | | | | | | | 6.61 |
| Rio Fajardo Nr Fajardo | | | | | | | | 6.48 |
| Lago El Guineo | | | | | | | | 6.35 |
| Pueblo Del Rio Gurabo | | | | | | | | 6.03 |
| Cerro La Punta / Jayuya | | | | | | | | 5.94 |
| Juncos 1NNE | | | | | | | | 5.24 |
| La Plaza 7S Caguas | | | | | | | | 5.15 |
| Rio Cerrillos Ponce | | | | | | | | 5.11 |
| Rio Maunabo | | | | | | | | 5.01 |
| Central Aguirre - South Coast | | | | | | | | 4.55 |
| Barrio Beatriz/Caguas | | | | | | | | 4.48 |
| Montones Las Piedras | | | | | | | | 4.42 |
| Bisley STN El Yunque | | | | | | | | 4.26 |
| Bairro Arriba/Caguas | | | | | | | | 3.01 |
bDate/time is for sustained wind when both sustained and gust are listed
@Unofficial observer data
cStorm surge is water height above normal astronomical tide level
dStorm tide is water height above NGVD
Table 3.
Hurricane Lenny ship observations of 34 knots or higher winds, November 1999.
Ship Call Sign
|
Lat. (°N) |
Lon. (°W) |
Date/ Time
(UTC) |
Pressure
(mb) |
Sustained Wind
(kt) |
Significant
Wave Height (ft) |
| LAUS4 | 18.4 | 76.7 | 14/0000 | 1013.9 | 36 | 7 |
| PDXQ | 14.0 | 81.8 | 15/0900 | 1006.5 | 37 | M |
| ELVB6 | 13.4 | 78.8 | 15/1500 | 1005.0 | 37 | M |
| ELVK5 | 16.6 | 74.5 | | 1001.0 | 39 | M |
| OYUY4 | 15.2 | 72.2 | 15/1800 | 1002.0 | 35 | 10 |
| FNIH | 14.0 | 72.2 | 15/2100 | 1000.2 | 40 | 16 |
| OYUY4 | 14.9 | 72.1 | | 999.8 | 35 | 10 |
| ELVK5 | 15.4 | 76.0 | | 1002.0 | 35 | M |
| FNIH | 13.9 | 72.7 | 16/0000 | 998.2 | 40 | 20 |
| OYUY4 | 14.3 | 71.9 | | 998.5 | 37 | 13 |
| FNIH | 13.9 | 73.0 | 16/0300 | 999.8 | 44 | 20 |
| OYUY4 | 14.0 | 72.0 | | 1000.0 | 37 | M |
| OYUY4 | 13.5 | 72.1 | 16/0600 | 999.0 | 45 | 20 |
| OYUY4 | 13.4 | 72.2 | 16/0900 | 1000.0 | 40 | 20 |
| PEXV | 12.6 | 71.4 | 16/1200 | 1005.6 | 39 | 13 |
| ZCBH9 | 12.7 | 71.2 | | 1003.6 | 35 | 13 |
| OYUY4 | 13.5 | 72.3 | | 1003.5 | 40 | 10 |
| OYUY4 | 13.3 | 72.8 | 16/1500 | 1007.9 | 40 | 10 |
| OYUY4 | 12.3 | 73.5 | 16/2100 | 1005.0 | 35 | 13 |
| V7BV7 | 14.7 | 67.6 | 17/0000 | 996.6 | 50 | 10 |
| V2DW | 14.6 | 70.0 | 17/0300 | 1006.0 | 41 | M |
| V7BV7 | 14.6 | 68.1 | 17/0600 | 1002.5 | 50 | 13 |
| PFRO | 15.8 | 62.8 | 18/2100 | 1005.0 | 41 | 20 |
| ELTO4 | 15.7 | 62.4 | 20/0000 | 1002.0 | 38 | 3 |
| MOBILE | 15.7 | 59.1 | 20/1200 | 1009.5 | 35 | 10 |
aDate/time is for sustained wind when both sustained and gust are listed
M - missing data
Table 4.
Hurricane Lenny selected amateur radio surface weather reports, November 1999.
| Call Sign |
Location |
Date/Time
(UTC) |
Pressure
(mb) |
Sustained Wind
(mph) |
Peak Wind
(mph) |
| BN2BT | St. Thomas USVI | 17/1656 | 995.0 | 35 | 71 |
| G0PBQ/FS | St. Martin - North End | 18/2110 | 988.5 | | |
| KC6OXM | Tortola - East End | 17/0130 | 996.0 | 110-120* | 130* |
| " | | 17/2125 | 995.0 | 65-70 | 102 |
| KF4SZ | Viequez Island | 17/1550 | | 40 | 53 |
| KP2G | St. John USVI | 17/1900 | 993.2 | 81 | 85+ |
| KV4F2 | St. Croix USVI | 17/1423 | 997.3 | 45 | 75 |
| " | | 17/1506 | | 50 | 80 |
| " | | 17/2125 | 995.0 | 65-70 | 102 |
| N3YMJ | Virgin Gorda BVI | 17/0159 | 988.8 | 55 | 85 |
| NP2B | St. Croix USVI | 17/1410 | 1002.0 | 30-40 | 63 |
| " | | 17/1509 | 999.7 | 45-50 | 63 |
| " | | 17/1705 | 993.7 | 50-55 | 78 |
| " | | 17/1800 | 988.5 | 60 | 94 |
| " | | 17/1850 | 984.1 | 60+ | 94 |
| " | | 17/2000 | 980.0 | 60-70 | 112 |
| " | | 17/2115 | 984.4 | 50-60 | 75-80 |
| " | | 17/2301 | 988.8 | 70-80 | 90+ |
| PJ8DM | Saba (Elev:2600 Feet) | 17/1714 | 1005.3 | 40 | 66 |
| " | | 17/1916 | 1003.4 | 40 | 64 |
| " | | 17/2335 | | | 80 |
| " | | 18/0345 | 1000.0 | 67 | 80 |
| " | | 18/0426 | 998.0 | 79 | |
| " | Report from Neighbor @ 700 ft | 18/0435 | 998.0 | | 101 |
| " | | 18/1148 | 994.0 | | |
| " | | 18/1345 | 984.0 | | 82 |
| " | | 18/1430 | 983.0 | 79 | 108 |
| VA3GSG | St. Martin | 18/0340 | | 45-50 | |
| W0NB/KP2 | St. John USVI | 17/1843 | 995.3 | 73 | 75 |
* - Estimated
Table 5.
Preliminary track forecast evaluation of Hurricane Lenny - heterogeneous
sample. Errors in nautical miles for tropical storm and hurricane stages
with number of forecasts in parenthesis. Numbers in bold type represent
forecasts which were better than the official forecast.
| Forecast Technique |
Period (hours) |
| 12 | 24 | 36 | 48 | 72 |
| CLIP | 53 (24) | 131 (22) | 226 (20) | 326 (18) | 526 (14) |
| LBAR | 52 (24) | 120 (22) | 198 (20) | 295 (18) | 668 (14) |
| BAMD | 58 (25) | 122 (23) | 183 (21) | 246 (19) | 398 (15) |
| BAMM | 52 (24) | 108 (22) | 165 (20) | 239 (18) | 393 (14) |
| BAMS | 70 (25) | 135 (23) | 192 (21) | 241 (19) | 305 (15) |
| NGPI | 66 (15) | 165 (13) | 281 (10) | 326 (8) | 362 (4) |
| NGPS* | 252 (13) | 266 (12) | 316 (10) | 367 (9) | 334 (7) |
| UKMI | 55 (15) | 103 (14) | 138 (13) | 169 (12) | 195 (10) |
| UKM* | 52 (13) | 87 (12) | 122 (11) | 158 (10) | 233 (8) |
| A90E | 54 (24) | 115 (22) | 177 (20) | 243 (18) | 371 (14) |
| A98E | 54 (24) | 116 (22) | 186 (20) | 262 (18) | 368 (14) |
| A9UK | 57 (12) | 125 (11) | 192 (10) | 240 (9) | 257 (7) |
| |
| NHC Official | 40 (25) | 93 (23) | 156 (21) | 213 (19) | 323 (15) |
| NHC Official 10-Year Average (1989-1998) | 48 (2005) | 89 (1790) | 128 (1595) | 164 (1410) | 242 (1107) |
* - Output from these models was unavailable at time of forecast issuance.
Table 6.
Watch and warning summary, Hurricane Lenny, November 1999.
Date/Time
(UTC) |
Action |
Location |
| 14/2100 | Tropical Storm Warning and Hurricane Watch Issued | Jamaica |
| 15/0000 | Hurricane Watch Issued | South coast of Haiti |
| 15/1700 | Hurricane Watch Issued | South coast of the Dominican Republic, Perdenales to Cabo Engano |
| 15/1800 | Tropical Storm Warning and Hurricane Watch Discontinued | Jamaica |
| 15/2100 | Hurricane Watch Issued | Puerto Rico and the U.S. and British Virgin Islands |
| 16/0300 | Tropical Storm Warning Issued | South Coast of the Dominican Republic from Cabo Beata to Cabo Engano |
| " | Hurricane Warning Issued | Puerto Rico and the U.S. and British Virgin Islands |
| 16/1500 | Tropical Storm Warning and Hurricane Watch Issued | Dutch St. Maarten, St. Eustatius, Saba, Anguilla, Nevis, St. Kitts, Montserrat, Barbuda and Antigua |
| " | Hurricane Watch Discontinued | Haiti |
| 16/2100 | Hurricane Warning Issued | Dutch St. Maarten, St. Eustatius, Saba, Anguilla, Nevis, St. Kitts |
| " | Tropical Storm Warning and Hurricane Watch Issued | Dominican Republic, Punta Palenque to Sabana De La Mar |
| " | Tropical Storm Warning and Hurricane Watch discontinued | Elsewhere in the Dominican Republic |
| 17/0300 | Hurricane Warning Issued | Montserrat, Barbuda and Antigua |
| " | Tropical Storm Warning and Hurricane Watch discontinued | Dominican Republic |
| 17/0500 | Hurricane Warning Issued | French St. Martin |
| 17/2100 | Hurricane Warning Downgraded to Tropical Storm Warning | Mainland Puerto Rico |
| 18/0300 | Tropical Storm Warning Discontinued | Mainland Puerto Rico west of a Ponce-Manati line |
| 18/1500 | Tropical Storm Warning Discontinued | Mainland Puerto Rico east of a Ponce-Manati line |
| " | Hurricane Warning Downgraded to Tropical Storm Warning | Culebra and Vieques |
| 18/2100 | Hurricane Warning Discontinued | U.S. and British Virgin Islands |
| " | Tropical Storm Warning Discontinued | Culebra and Vieques |
| 19/2100 | Hurricane Warning Discontinued | Dutch St. Maarten, St. Eustatius, Saba, Anguilla, Nevis, St. Kitts |
| " | Hurricane Warning Downgraded to Tropical Storm Warning | Montserrat, Barbuda and Antigua |
| 20/0900 | Tropical Storm Warning Discontinued | Montserrat, Barbuda and Antigua |
![[NCEP Logo]](graphics/ncep.gif)