Hurricane HOME ARCHIVES FORECASTS IMAGERY ABOUT TPC RECONNAISSANCE
[NCEP Logo]


Text-only version
(printer friendly)

Preliminary Report
Tropical Storm Emily
24 - 28 August 1999

Lixion A. Avila
National Hurricane Center
30 September 1999


PRELIMINARY REPORTS
Tropical Storm Arlene
Tropical Depression Two
Hurricane Bret
Hurricane Cindy
Hurricane Dennis
Tropical Storm Emily
Tropical Depression Seven
Hurricane Floyd
Hurricane Gert
Tropical Storm Harvey
Tropical Depression Eleven
Tropical Depression Twelve
Hurricane Irene
Hurricane Jose
Tropical Storm Katrina
Hurricane Lenny


[1999 Atlantic Hurricane Season]

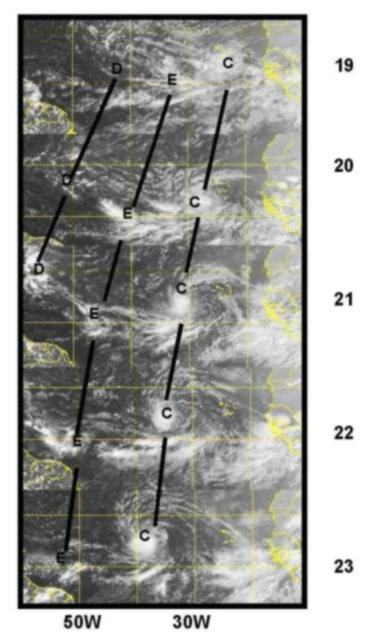
Emily formed about 360 n mi east of the southern Windward Islands and its track and intensity were primarily controlled by the much larger circulation of Hurricane Cindy.

a. Synoptic History

Fig 1. Sequence of once a day GOES-8 visible satellite images at 1745 UCT from 19 to 23 August 1999 showing the westward propagation of the tropical waves which eventually triggered Dennis (D), Emily (E), and Cindy (C).
Vertical timesections constructed from RAOB data from Dakar and low-level cloud wind analysis from the University of Wisconsin show three distinct wind-shifts associated with a cluster of tropical waves which moved off the coast of Africa between the 14th and the 19th of August.
Figure 1 is a sequence of once a day satellite images which shows the evolution of these tropical waves while moving over the tropical Atlantic and from which Dennis, Emily and Cindy eventually formed. The area of low-cloud cyclonic rotation and thunderstorm activity associated with the pre-Emily tropical wave (marked with E in Fig.1) moved toward the west-southwest and gradually became organized. A post-analysis of satellite images and surface data indicates that a tropical depression formed at 0600 UTC 24 August about 360 n mi east of the southern Windward Islands. An Air Force reconnaissance plane reached the area later on that day and found a small circulation of 1004 mb central pressure and 55-knot winds at 1500 feet. Surface winds were estimated to be 45 knots at this time and this turned out to be Emily's peak intensity.

Emily was in a strong shearing environment resulting from both the outflow and the inflow of the much larger Cindy, which was gradually approaching Emily. Consequently, the deep convection was at times removed from the circulation. However, convective bursts continued to redevelop near the center. Because of the high variability in the convection throughout the entire lifetime of the tropical cyclone, Dvorak T-numbers were up and down. Reconnaissance data indicated that the maximum intensity remained between 35 and 40 knots during that period.

Cindy disrupted the easterly trade-wind flow around Emily and resulted in Emily moving slowly toward the northwest and north embedded within a weak steering flow. Emily eventually was absorbed by the much larger circulation associated with Cindy on the 28 August.

Emily's track is shown in Figure 2. Table 1 is a listing, at six-hourly intervals, of the best-track position, estimated minimum central pressure and maximum 1-minute surface wind speed.


Fig 2. Best track positions for Tropical Storm Emily, 24-28 August 1999

b. Meteorological Statistics

The best track pressure and wind curves as a function of time are shown in Figure 3 and are primarily based on data provided from the six reconnaissance missions flown into Emily by Air Force aircraft. Satellite intensity estimates from the Tropical Analysis and Forecast Branch (TAFB), the Satellite Analysis Branch (SAB) and the Air Force Weather Agency, (AFGWC in the figures) and data from drifting buoys were also included in the analysis.


Fig 3. Best track minimum central pressure and maximum sustained winds speed curves for Tropical Storm Emily.

c. Casualty and Damage Statistics

There are no reports of casualty and damage from Emily.

d. Forecast and Warning Critique

Although the formation of a tropical depression was forecast, advisories on Emily were not initiated until data from the Air Force reconnaissance plane indicated that the system was already a fully developed tropical storm. Due to the high variability on the convection, Dvorak T-numbers were low and did not justify tropical storm or even tropical depression intensity at that time. Emily was forecast to reach hurricane status based on the Statistical Hurricane Intensity Prediction Scheme (SHIPS) and the GFDL models but the storm never acquired winds higher than 45 knots.

The NHC average official track errors in n mi for Emily (excluding the tropical depression stage) were 31 (13 cases), 70 (11 cases), 130 (9 cases), 208 (7 cases) and 332 (3 cases), respectively, for the 12-, 24-, 36-, 48-, and 72-hour forecast periods. These errors for 12, 24 and 36 hour periods are very near the 1989-1998 average official forecast errors. However, the errors for 48 and 72 hours were nearly 30% larger than the average.


Table 1. Best track, Tropical Storm Emily, 24- 28 August, 1999
Date/Time
(UTC)
Position Pressure
(mb)
Wind Speed
(kt)
Stage
Lat. (°N)Lon. (°W)
24/060011.553.6100730tropical depression
120011.553.8100635tropical Storm
180011.653.9100445 "
25/000012.153.9100545"
060012.654.2100640"
120012.854.8100740"
180013.255.2100540"
26/000013.855.7100540"
060014.356.2100740"
120015.056.6101040"
180015.857.0101035"
27/000017.057.1101035"
060018.057.0101135"
120019.057.0100935"
180020.057.0100740"
28/000021.156.6100740"
060024.456.7100935"
120023.856.7100930tropical depression
1800 absorbed by Cindy
 
24/180011.653.9100445Minimum Pressure


nhcwebmaster

Last updated January 24, 2000