 |
|
2003 Assisted Reproductive Technology (ART) Report: Section 5—Trends
in ART, 1996–2003 |
|
This report marks the ninth consecutive year that CDC has published an
annual report detailing the success rates for ART clinics in the United
States. Having several years of data provides us with the opportunity to
examine trends in ART use and success rates over time. Because the first
year of data collection, 1995, did not include non-SART member clinics, we
limit our examination of trends to the years 1996–2003. |
Is the use of ART increasing?
Figure 43 shows the numbers of
ART cycles performed, live-birth deliveries, and infants born using ART
from 1996 through 2003. The number of ART cycles performed in the United
States has almost doubled, from 64,681 cycles in 1996 to 122,872 in 2003.
The number of live-birth deliveries in 2003 (35,785) was about two and a
half times higher than in 1996 (14,507). The number of infants born who
were conceived using ART also increased steadily between 1996 and 2003. In
2003, 48,756 infants were born, which was more than double the 20,840 born
in 1996. Because in some cases more than one infant is born during a
live-birth delivery (e.g., twins), the total number of infants born is
greater than the number of live-birth deliveries.
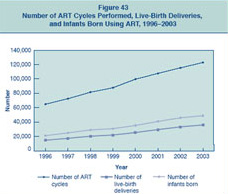
Figure 43: Number of ART Cycles
Performed, Live-Birth Deliveries, and Infants Born Using ART, 1996–2003.
|
|
Are live birth rates improving?
Figure 44
presents live birth rates for the four primary types of ART procedures.
Live birth rates are presented per transfer rather than per cycle because
that is the only way to directly compare cycles using fresh embryos with
those using frozen embryos. Trends in live birth rates were considered in
two ways. First, we assessed whether there was a change in the live birth
rate over the previous year (that is, we compared the 2003 live birth
rates with the 2002 live birth rates). We also assessed the total change
in live birth rates from 1996 (the first full year of data collection)
through 2003.
Between 2002 and 2003, the live birth rates were comparable
for all types of ART procedures. From 1996 through 2003, live birth rates
increased 24% for fresh–nondonor cycles, 62% for frozen–nondonor cycles, 31%
for fresh–donor cycles, and 45% for frozen–donor cycles.
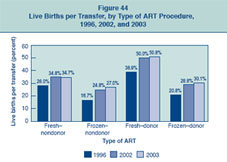
Figure 44: Live Births per
Transfer, by Type of ART Procedure, 1996, 2002, and 2003.
|
|
Are singleton live birth rates improving?
Singleton live births are an important measure of success
because they have a much lower risk
than multiple-infant births for adverse infant health outcomes, including
prematurity, low birth
weight, disability, and death. Figure 45 presents singleton live birth
rates for the four primary
types of ART procedures. Singleton live birth rates are presented per
transfer rather than per
cycle because that is the only way to directly compare cycles using fresh
embryos with those
using frozen embryos. Trends in singleton live birth rates were considered
in two ways. First,
we assessed whether there was a change in the singleton live birth rate
over the previous year
(that is, we compared the 2003 singleton live birth rates with the 2002
singleton live birth
rates). We also assessed the total change in singleton live birth rates
from 1996 (the first full
year of data collection) through 2003.
Between 2002 and 2003, the singleton live birth rates were comparable for
all types of ART
procedures. From 1996 through 2003, the singleton live birth rates
increased 33% for fresh–nondonor cycles, 66% for frozen–nondonor cycles, 34% for fresh–donor
cycles, and 46% for
frozen–donor cycles.
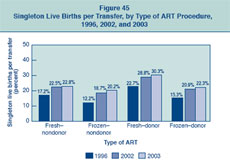
Figure
45: Singleton Live Births per Transfer, by Type of ART Procedure,
1996, 2002, and 2003.
|
|
Are live birth rates improving for all ART patients or
only for those in particular age groups?
Figure 46
presents live birth rates per transfer, by woman’s age, for ART cycles
using fresh nondonor eggs or embryos. Trends in live birth rates were
considered in two ways. First, we assessed whether there was a change in
the live birth rate over the previous year (that is, we compared the 2003
live birth rates with the 2002 live birth rates). We also assessed the
total change in live birth rates from 1996 (the first full year of data
collection) through 2003.
Between 2002 and 2003, the live birth rates were comparable
for women in all age groups. The increases in live birth rates from 1996
through 2003 were 29% for women younger than 35, 26% for women 35–37, 21%
for women 38–40, 31% for women 41–42, and 9% for women older than 42.
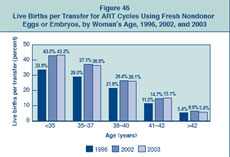
Figure
46: Live Births per Transfer for ART Cycles Using Fresh Nondonor Eggs
or Embryos, by Woman's Age, 1996, 2002, and 2003.
|
|
Are singleton live birth rates improving for all ART
patients or only for those in particular age groups?
Singleton live births are an important measure of success
because they have a much lower
risk than multiple-infant births for adverse infant health outcomes,
including prematurity, low birth weight, disability, and death.
Figure 47 presents singleton
live birth rates per transfer, by woman’s age, for ART cycles using fresh
nondonor eggs or embryos. Trends in singleton live birth rates were
considered in two ways. First, we assessed whether there was a change in
the singleton live birth rate over the previous year (that is, we compared
the 2003 singleton live birth rates with the 2002 singleton live birth
rates). We also assessed the total change in singleton live birth rates
from 1996 (the first full year of data collection) through 2003.
Between 2002 and 2003, the singleton live birth rates were
comparable for women in all age groups. From 1996 through 2003, the
singleton live birth rate for women younger than 35 increased about 40%,
from about 19% in 1996 to almost 27% in 2003. Likewise, over the same time
period, live birth rates increased 36% for women 35–37, 25% for women 38–40,
31% for women 41–42, and 15% for women older than 42.
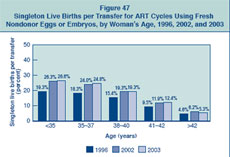
Figure
47: Singleton Live Births per Transfer for ART Cycles Using Fresh
Nondonor Eggs or Embryos, by Woman's Age, 1996, 2002, and 2003.
|
|
Have multiple-infant birth rates
changed?
Multiple-infant births are associated with greater
problems for both mothers and infants,
including higher rates of caesarean section, prematurity, low birth
weight, and infant disability or death.
Figure 48 shows multiple-infant
birth rates for the four primary types of ART procedures. Trends in
multiple-infant birth rates were considered in two ways. First, we
assessed whether there was a change in these rates over the previous year
(that is, we compared the 2003 rates with the 2002 rates). We also
assessed the total change in multiple-infant birth rates from 1996 (the
first full year of data collection) through 2003.
Between 2002 and 2003, the multiple-infant birth rates
decreased 5% for both fresh–donor and frozen–donor cycles and about 3% for
fresh–nondonor cycles. During the same time period, multiple-infant birth
rates increased 3% for frozen–nondonor cycles. The multiple-infant birth
rates from 1996 to 2003 decreased 11% for fresh–nondonor cycles, 6% for
frozen–nondonor cycles, and 3% for fresh–donor cycles. The multiple-infant
birth rates from 1996 through 2003 were similar for frozen–donor cycles.
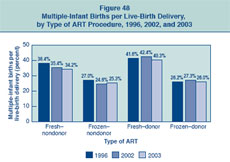
Figure
48: Multiple-Infant Births per Live-Birth Delivery, by Type of ART
Procedure, 1996, 2002, and 2003.
|
|
Have twin and triplet-or-more birth rates changed?
Figure 49
compares twin and triplet-or-more birth rates for ART cycles using fresh
nondonor eggs or embryos in 1996 (the first full year of data collection),
2002, and 2003. Twins made up the vast majority of multiple-infant births
in each of these years. Since 1996, the triplet-or-more birth rate for
fresh–nondonor cycles has decreased, but there has been no change in the
twin birth rate.
It is important to note that twins, albeit to a lesser
extent than triplets or more, are still at substantially greater risk for
illness and death than singletons. These risks include low birth weight,
preterm birth, and neurological impairments such as cerebral palsy. Both the
twin and triplet-or-more birth rates remain significantly higher for ART
births than for births resulting from natural conception.
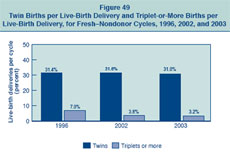
Figure
49: Twin Births per Live-Birth Delivery and Triplet-or-More Births per
Live-Birth Delivery, for Fresh–Nondonor Cycles, 1996, 2002, and 2003.
|
Section
1 | Section 2 |
Section
3 | Section 4 |
Section
5
Previous ART Reports
Implementation of the Fertility
Clinic Success Rate and Certification Act of 1992
Assisted Reproductive Technology: Embryo
Laboratory
Date last reviewed:
03/27/2006
Content source: Division
of Reproductive Health,
National Center for Chronic Disease
Prevention and Health Promotion
|
|
|