Department of Health and Human Services
Centers for Disease Control and Prevention
This report marks the seventh consecutive year that CDC has published an annual report detailing the success rates for ART clinics in the United States. Having several years of data gives us the opportunity to examine trends in ART use and success rates over time. Because the first year of data collection, 1995, did not include non-SART member clinics, we limit our examination of trends to the years 1996–2001. Is the use of ART increasing?Figure 40 shows the number of ART cycles performed, the number of live-birth deliveries, and the number of live infants born using ART from 1996 to 2001. The number of ART cycles performed in the United States increased 66% overall, from 64,724 cycles in 1996 to 107,587 in 2001. The number of live-birth deliveries increased 101%, from 14,573 in 1996 to 29,344 in 2001. The number of live babies born who were conceived using ART also increased steadily between 1996 and 2001. In 2001, a total of 40,687 infants were born, an increase of 94% over the 20,921 born in 1996. Because in some cases more than one infant is born during a live-birth delivery (e.g., twins), the total number of live babies born is greater than the number of live-birth deliveries.
Figure 40: Number of ART Cycles Performed, Number of Live-Birth Deliveries, and Number of Live Babies Born Using ART, 1996–2001.
Are live birth rates improving?Figure 41 presents live birth rates for the four primary types of ART cycles. Live birth rates are presented per transfer rather than per cycle because that is the only way to directly compare cycles using fresh embryos with those using frozen embryos. Trends in live birth rates were considered in two ways. First, we assessed whether there was a change in the live birth rate over the previous year (that is, we compared the 2001 live birth rates with the 2000 live birth rates). We also assessed the total change in live birth rates from 1996 (the first full year of data collection) to 2001. Between 2000 and 2001, the live birth rate for fresh–nondonor cycles increased 6%, from 31.6% in 2000 to 33.4% in 2001. Likewise, over the same time period live birth rates increased 15% for frozen–nondonor cycles, 8% for fresh–donor cycles, and 14% for frozen–donor cycles. The live birth rates from 1996 to 2001 increased 19% for fresh–nondonor cycles, 40% for frozen–nondonor cycles, 21% for fresh–donor cycles, and 31% for frozen–donor cycles.
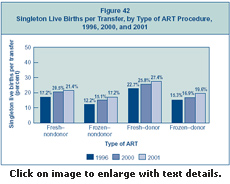
Are singleton live birth rates improving?Singleton births are an important measure of success because they have a much lower risk than multiple-infant births for adverse infant health outcomes, including prematurity, low birth weight, disability, and death. Figure 42 presents singleton live birth rates for the four primary types of ART cycles. Singleton live birth rates are presented per transfer rather than per cycle because that is the only way to directly compare cycles using fresh embryos with those using frozen embryos. Trends in singleton live birth rates were considered in two ways. First, we assessed whether there was a change in the singleton live birth rate over the previous year (that is, we compared the 2001 singleton live birth rates with the 2000 singleton live birth rates). We also assessed the total change in singleton live birth rates from 1996 (the first full year of data collection) to 2001. Between 2000 and 2001, the live birth rate for fresh–nondonor cycles increased 4%, from 20.5% in 2000 to 21.4% in 2001. Likewise, over the same time period live birth rates increased 14% for frozen–nondonor cycles, 6% for fresh–donor cycles, and 16% for frozen–donor cycles. The singleton live birth rates from 1996 to 2001 increased 24% for fresh–nondonor cycles, 41% for frozen–nondonor cycles, 21% for fresh–donor cycles, and 28% for frozen–donor cycles.
Figure 42: Singleton Live Births per Transfer, by Type of ART Procedure, 1996, 2000, and 2001.
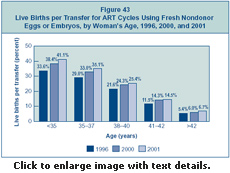
Are live birth rates improving for all ART patients or only for those in particular age groups?Figure 43 presents live birth rates per transfer, by woman’s age, for ART cycles using fresh nondonor eggs or embryos. Trends in live birth rates were considered in two ways. First, we assessed whether there was a change in the live birth rate over the previous year (that is, we compared the 2001 live birth rates with the 2000 live birth rates). We also assessed the total change in live birth rates from 1996 (the first full year of data collection) to 2001. Between 2000 and 2001, the live birth rate increased 7% for women younger than 35, from 38.4% in 2000 to 41.1% in 2001. Likewise, over the same time period, live birth rates increased 6% among women 35–37, 5% for women 38–40, 1% for women 41–42, and 12% for women older than 42. The increase in live birth rates from 1996 to 2001 was 22% for women younger than 35, 21% for women 35–37, 18% for women 38–40, 26% for women 41–42, and 24% for women older than 42.
Figure 43: Live Births per Transfer for ART Cycles Using Fresh Nondonor Eggs or Embryos, by Woman’s Age, 1996, 2000, and 2001.
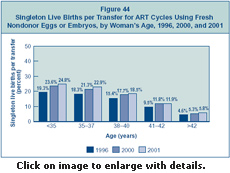
Are singleton live birth rates improving for all ART patients or only for those in particular age groups?Singleton live births are an important measure of success because they have a much lower risk than multiple-infant births for adverse infant health outcomes, including prematurity, low birth weight, disability, and death. Figure 44 presents singleton live birth rates per transfer, by woman’s age, for ART cycles using fresh nondonor eggs or embryos. Trends in singleton live birth rates were considered in two ways. First, we assessed whether there was a change in the singleton live birth rate over the previous year (that is, we compared the 2001 singleton live birth rates with the 2000 singleton live birth rates). We also assessed the total change in singleton live birth rates from 1996 (the first full year of data collection) to 2001. Between 2000 and 2001, the singleton live birth rate increased only slightly for all age groups. From 1996 to 2001, the singleton live birth rate for women younger than 35 increased 28%, from 19.3% in 1996 to 24.8% in 2001. Likewise, over the same time period live birth rates increased 25% for women 35–37; 20% for women 38–40; 25% for women 41–42; and 26% for women older than 42.
Figure 44: Singleton Live Births per Transfer for ART Cycles Using Fresh Nondonor Eggs or Embryos, by Woman’s Age, 1996, 2000, and 2001.
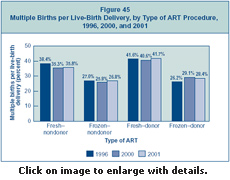
Have multiple birth rates changed?Multiple births are associated with greater problems for both mothers and infants, including higher rates of caesarean section, prematurity, low birth weight, and infant disability or death. Figure 45 shows multiple birth rates for the four primary types of ART cycles. Trends in multiple birth rates were considered in two ways. First, we assessed whether there was a change in the multiple birth rate over the previous year (that is, we compared the 2001 multiple birth rates with the 2000 multiple birth rates). We also assessed the total change in multiple birth rates from 1996 (the first full year of data collection) to 2001. Multiple birth rates have remained relatively stable since 1996.
Figure 45: Multiple Births per Live-Birth Delivery, by Type of ART Procedure, 1996, 2000, and 2001.
Section 1 | Section 2 | Section 3 | Section 4 | Section 5
Implementation of the Fertility Clinic Success Rate and Certification Act of 1992 Assisted Reproductive Technology: Embryo Laboratory
Date last reviewed:
03/23/2006 |
|
|
|||||||||||||||||||||||||||||||||||||||||||||||||||
|
|
|
||||||||||||
|
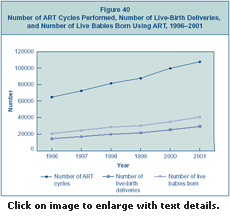
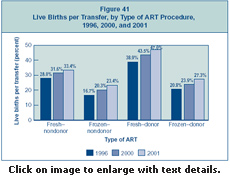 Figure 41: