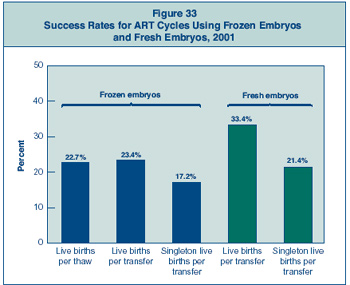
Figure 33 is a bar graph representing success rates for ART
cycles using frozen
embryos and for those using fresh embryos, 2001.
- Frozen Embryos (subject heading is divided into the following three
categories):
- Live births per thaw, 22.7%
- Live births per transfer, 23.4%
- Singleton live births per transfer, 17.2%
- Fresh Embryos (subject heading is divided into the following two
categories):
- Live births per transfer, 33.4%
- Singleton live births per transfer, 21.4%
Figure 34
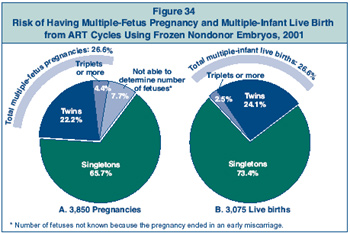
Figure 34 contains two pie charts (A & B) showing the risk of having
multiple-fetus pregnancy and multiple-infant live birth from ART cycles
using frozen, nondonor embryos, 2001.
Chart A represents 3,850 pregnancies, of which 26.6% were
multiple-fetus pregnancies.
These 3,850 pregnancies are further broken down as follows:
- Singletons: 65.7%
- Twins: 22.2%
- Triplets or more: 4.4%
- Not able to determine because the pregnancy ended in miscarriage:
7.7%
Chart B represents 3,075 live births, of which 26.8% were
multiple-infant births.
These 3,075 live births are further broken down as follows:
- Singletons: 73.2%
- Twins: 24.2%
- Triplets or more: 2.6%
Section
1 | Section 2 |
Section
3 | Section 4 |
Section
5
Previous ART Reports
Implementation of the Fertility
Clinic Success Rate and Certification Act of 1992
Assisted Reproductive Technology: Embryo
Laboratory
Date last reviewed:
03/27/2006
Content source: Division
of Reproductive Health,
National Center for Chronic Disease
Prevention and Health Promotion