The Water Cycle (Water Science for Schools)
The Water Cycle ¦ Water Science for Schools ¦ Contact us ¦ Back
 Precipitation is water released from clouds in the form of rain, freezing rain, sleet, snow, or hail. It is the primary connection in the water cycle that provides for the delivery of atmospheric water to the Earth. Most precipitation falls as rain.
 The clouds floating overhead contain water vapor and cloud droplets, which are small drops of condensed water. These droplets are way too small to fall as precipitation, but they are large enough to form visible clouds. Water is continually evaporating and condensing in the sky. If you look closely at a cloud you can see some parts disappearing (evaporating) while other parts are growing (condensation). Most of the condensed water in clouds does not fall as precipitation because their fall speed is not large enough to overcome updrafts which support the clouds. For precipitation to happen, first tiny water droplets must condense on even tinier dust, salt, or smoke particles, which act as a nucleus. Water droplets may grow as a result of additional condensation of water vapor when the particles collide. If enough collisions occur to produce a droplet with a fall velocity which exceeds the cloud updraft speed, then it will fall out of the cloud as precipitation. This is not a trivial task since millions of cloud droplets are required to produce a single raindrop. A more efficient mechanism (known as the Bergeron-Findeisen process) for producing a precipitation-sized drop is through a process which leads to the rapid growth of ice crystals at the expense of the water vapor present in a cloud. These crystals may fall as snow, or melt and fall as rain.
 Let me introduce myself - I am Drippy, the (un)official USGS water-science icon. It is obvious that I am a raindrop, right? After all, all of you know that raindrops are shaped, well ... like me. As proof, you've probably seen me on television, in magazines, and in artists' representations. Truth is, I am "Drippy" and actually I am shaped more like a drip falling from a water faucet than a raindrop. The common raindrop is actually shaped more like a hamburger bun.
 As Alistair Frasier explains in his web page, Bad Rain, small raindrops, those with a radius of less than 1 millimeter (mm), are spherical, like a round ball. As droplets collide and grow in size, the bottom of the drop begins to be affected by the resistance of the air it is falling through. The bottom of the drop starts to flatten out until at about 2-3 mm in diameter the bottom is quite flat with an indention in the middle - much like a hamburger bun. Raindrops don't stop growing at 3 millimeters, though, and when they reach about 4-5 mm, things really fall apart. At this size, the indentation in the bottom greatly expands forming something like a parachute with two smaller droplets at the bottoms. The parachute doesn't last long, though, and the large drop breaks up into smaller drops.
Precipitation does not fall in the same amounts throughout the world, in a country, or even in a city. Here in Georgia, USA, it rains fairly evenly all during the year, around 40-50 inches (102-127 centimeters (cm)) per year. Summer thunderstorms may deliver an inch or more of rain on one suburb while leaving another area dry a few miles away. But, the rain amount that Georgia gets in one month is often more than Las Vegas, Nevada observes all year. The world's record for average-annual rainfall belongs to Mt. Waialeale, Hawaii, where it averages about 450 inches (1,140 cm) per year. A remarkable 642 inches (1,630 cm) was reported there during one twelve-month period (that's almost 2 inches (5 cm) every day!). Is this the world record for the most rain in a year? No, that was recorded at Cherrapunji, India, where it rained 905 inches (2,300 cm) in 1861. Contrast those excessive precipitation amounts to Arica, Chile, where no rain fell for 14 years, and in Bagdad, California, where precipitation was absent for 767 consecutive days from October 1912 to November 1914.
The map below shows average annual precipitation, in millimeters and inches, for the world. The light green areas can be considered "deserts". You might expect the Sahara area in Africa to be a desert, but did you think that much of Greenland and Antarctica are deserts?

On average, the 48 continental United States receives enough precipitation in one year to cover the land to a depth of 30 inches (0.76 meters).
Have you ever watched a raindrop hit the ground during a large rainstorm and wondered how big the drop is and how fast it is falling? Or maybe you've wondered how small fog particles are and how they manage to float in the air. The table below shows the size, velocity of fall, and the density of particles (number of drops per square foot/square meter of air) for various types of precipitation, from fog to a cloudburst.
| Intensity inches/hour (cm/hour) |
Median diameter (millimeters) |
Velocity of fall feet/second (meters/second) |
Drops per second per square foot (square meter) |
|
|---|---|---|---|---|
| Fog | 0.005 (0.013) | 0.01 | 0.01 (0.003) | 6,264,000 (67,425,000) |
| Mist | .002 (.005) | .1 | .7 (.21) | 2,510 (27,000) |
| Drizzle | .01 (.025) | .96 | 13.5 (4.1) | 14(151) |
| Light rain | .04 (1.02) | 1.24 | 15.7 (4.8) | 26 (280) |
| Moderate rain | .15 (.38) | 1.60 | 18.7 (5.7) | 46 (495) |
| Heavy rain | .60 (1.52) | 2.05 | 22.0 (76.) | 46 (495) |
| Excessive rain | 1.60 (4.06) | 2.40 | 24.0 (7.3) | 76 (818) |
| Cloudburst | 4.00 (10.2) | 2.85 | 25.9 (7.9) | 113 (1,220) |
| Source: Lull, H.W., 1959, Soil Compaction on Forest and Range Lands, U.S. Dept. of Agriculture, Forestry Service, Misc. Publication No.768 | ||||
 Can you guess how many baths you can get from a rainstorm?
Visit our Activity Center and find out.
![]() Rain: A Water Resource, USGS General Interest Publication
Rain: A Water Resource, USGS General Interest Publication
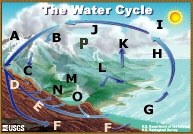 |
A - Storage in ice and snow B - Precipitation C - Snowmelt runoff to streams D - Infiltration E - Ground-water discharge F - Ground-water storage G - Water storage in oceans H - Evaporation |
I - Condensation J - Water storage in the atmosphere K - Evapotranspiration L - Surface runoff M - Streamflow N - Springs O - Freshwater storage P - Sublimation |

![]() U.S. Department of the Interior |
U.S. Geological Survey
U.S. Department of the Interior |
U.S. Geological Survey
URL: http://ga.water.usgs.gov/edu/watercycleprecipitation.html
Page Contact Information: Howard Perlman
Page Last Modified: Wednesday, 13-Aug-2008 07:26:38 EDT
