 |
 |

|
Print  Download Reader
|
|
|
Print Download Reader
Program Performance ReportOverviewThe Department of Health and Human Services (HHS) manages over 300 programs. It is one of the largest Federal agencies, the Nation’s largest health insurer, and the Federal Government’s largest grant-making agency. The HHS mission is to protect and promote the health and well-being of all Americans while providing world-class leadership in the areas of biomedical research, public health, and social services. HHS programs impact all Americans on a daily basis, through direct services and funding, scientific advances, and educational information that allow people to choose better health care options, medicine, and even food. Through numerous grants and other financing arrangements with both public and private service providers, HHS is committed to improving overall health and human service outcomes and the economic independence of individuals and families throughout the United States. In FY 2004, HHS published an updated Strategic Plan, which outlines the HHS strategic direction over the next 5 years. The eight strategic goals in the plan guide HHS for FY 2004 - FY 2009 in accomplishing its’ mission of protecting and improving the health and well-being of the American public. These eight goals provide a focus point for HHS program investments and serve as a framework for the measures that track the Department’s overall performance. The Office of the Secretary is responsible for providing overall policy guidance and direction to the Operating Divisions (OPDIVs) to help achieve the Department’s strategic goals. The strategic goals, performance goals, and program results reflect the combined commitment and effort of HHS programs, and their state, local, Federal, Tribal and non-government partners. These program partners will spend the overwhelming majority of the funds expended for HHS programs in FY 2005 to better the lives of all Americans. A copy of the updated HHS Strategic Plan for FY 2004 - FY 2009 is available at http://aspe.hhs.gov/hhsplan/. Data and Performance Measurement Sound information and data are essential to fulfilling the HHS mission of enhancing the health and well-being of every American. Information provided is the main ingredient to success for every HHS performance measure. Whether providing for effective health and human services, or fostering sustained advances in the sciences or public health system, reliable information is an essential tool used in planning, measuring results, and making sound decisions. Accordingly, the Department plays an essential role in producing the necessary data for program decision making, both as a direct producer and a partner in data collection with the states, grantees, and other governmental agencies. The HHS Data Council maintains a directory of all the major data systems supported by HHS OPDIVs, and all surveys on its website (http://aspe.hhs.gov/datacncl/index.shtml.) These data systems support most of the performance measurement objectives within HHS programs, as well as various broad health and social outcome indicators. HHS’ programs and OPDIVs rely upon accurate data in program management, policy decision making, and intervention development. The Government Performance and Results Act of 1993 (GPRA) emphasizes the importance of data for decision making and creates an incentive for staff throughout HHS to refine the Department’s data systems. HHS programs work extensively with partners in state, local, and Tribal governments; grantees; and Medicare contractors in program implementation and data collection to help meet these standards. The Department continuously identifies system enhancements that improve the timeliness, completeness, and accuracy of data and enables employees to implement more sophisticated performance measures. HHS has taken a number of steps to address key data needs in a coordinated fashion, promote a HHS-wide strategy on data issues, and strengthen the Department’s ability to work in collaboration with private sector entities, state and local governments, and other partners. The HHS Data Council serves as the principal senior level internal forum on data policy, and serves as the focal point for HHS data policy initiatives. Currently, the Data Council and its working groups are focusing efforts on the following:
As a result, HHS had made improvements in many data collection systems and in HHS-wide data planning and integration process. In addition, integrated, user-friendly access to and availability of the vast data resources in HHS is being improved through the creation of the Data Council’s Gateway to Data and Statistics on the Internet. Additional Department-wide initiatives developed by the Council include the HHS data quality initiative, improvements in geocoding standards and practices, data access and dissemination, statistical confidentiality, and coordination of data collection activities. However, new data needs for performance measurement are arising, and a number of critical data gaps remain. Additional challenges for performance related data include:
To address these needs from the Department-wide perspective in the annual budget process, the HHS Data Council works closely with the Office of Budget to review, coordinate, and prioritize all proposed investment requests to improve data and information for decision making. This process helps to ensure that data systems are responsive to performance measurement needs and the Secretary’s priorities. In addition, the Council also continually reviews plans for major data collection activities. Similarly, throughout HHS, data are being made available to OPDIVs and partners for planning, decision making, and measuring results. These efforts include developing new data collection systems, enhancing current data collection systems, eliminating systems that are no longer relevant, combining reporting where possible, and building the capacity to collect data at the state and local levels. Throughout this report, when current year performance data are unavailable, a date that the data will become available is provided. As required by Office of Management and Budget (OMB) guidance, HHS will report the results of all performance measures in future reports submitted to Congress. Guide to Section II The pages that follow provide an overview of performance measurement at HHS. The Department manages hundreds of programs, and the ones included in this report highlight the many ways that HHS is leading Americans to better health, safety, and well-being. This section highlights the efforts and accomplishments of dedicated program staff in a sample of program areas and provides information on the measures and goals of selected HHS programs. HHS selected programs that represent each of the Department’s eight strategic goals, and each of the OPDIVs that make up the Department. For a comprehensive view of all HHS performance goals and program activities, including the latest performance results, see the FY 2006 performance plans and reports included in the budget justification to Congress for the individual HHS OPDIVs or the FY 2007 performance budgets that will be submitted to Congress in February 2006. Qualified staff with a thorough knowledge of program content and current operations, including financial and management control procedures, performed the review process on the data for Section II. Assurance of the accuracy of data for Section II was achieved through data verification processes inherent in the recurring usage and updates of the data and tables. Analysts, managers, and executives in the HHS OPDIVs and in the Office of Budget verified the data reported on an ongoing basis. Section II data and narratives received a thorough review within the Office of Budget by budget and program branch chiefs with budget and performance responsibilities. Performance management and assessment activities related to GPRA, the Performance Assessment Rating Tool (PART), and other performance related activities include assurances of the accuracy of data in the Data Verification and Validation section of the OPDIVs’ annual performance plans and reports. These assurances are achieved through a first-level evaluation of data by Agency and Department GPRA and PART coordinators, followed by a second-level review and verification by specifically appointed managers and evaluators. In developing the programs and measures reported in the FY 2005 Performance and Accountability Report (PAR), HHS attempted to provide the best set of representative measures for HHS programs. Staff developed side-by-side comparisons of the strategic plan indicators and the FY 2006 performance plan measures and engaged OPDIVs and Office of Budget analysts and managers in discussions regarding what measures and programs should be included in the PAR. Budget and performance coordinators compared the strategic plan indicators to the priorities of the President and the Secretary to ensure that all HHS OPDIVs and all major priorities were included on the FY 2005 PAR list. This effort resulted in selecting measures for the FY 2005 PAR that best represent the work and activities of HHS OPDIVs that occurred during FY 2005. However, the selected measures do not always match up neatly with either the Department's Strategic Plan or the FY 2005 Performance Plan. This is because at the time the FY 2005 Performance Plan was prepared, HHS was still developing performance budget plans and had not completed the current FY 2004 - 2009 Strategic Plan. In some cases, measures found in the FY 2006 Performance Plan were more representative of the work and direction the Agency was moving in FY 2005. This process resulted in the list of highlighted programs reported in Section II. In this section of the PAR, HHS presents detailed performance information for 22 highlighted programs organized by the Department’s eight strategic goals. Each goal overview includes an introduction to the goal and a list of the selected programs and performance measures supporting the goal. Following the overview is a description of the program; a snapshot of the program’s performance targets and results for 4 fiscal years; a discussion of the program performance and results; a description of the data sources; and, if applicable, a summary of the results program evaluations and PART reviews for each program. The PART is an evaluation tool developed by OMB used for reviewing program performance. As a result of a PART review, a program receives a rating as well as OMB recommendations for program improvements. In many cases these recommendations may involve a more comprehensive program evaluation or changes in program legislation. For information on the PART ratings for all HHS programs assessed during the FY 2004 - FY 2006 budget processes, see the section on the PART following the discussion of strategic goal 8. Strategic Goal 1:Reduce the Major Threats to the Health and Well-being of Americans Each year, HHS renews its commitment to reduce health threats and promote healthy behaviors, and this commitment remains a critical priority. This goal supports the Department's vision to improve the health and well-being of people in this country and throughout the world. HHS recognizes that this vision can only be accomplished through coordination across the Department, and through partnerships with states, communities, and health professionals. Prevention remains at the forefront of the HHS approach to fighting Human Immunodeficiency Virus (HIV)/Acquired Immunodeficiency Syndrome (AIDS), sexually transmitted diseases, and tuberculosis. HHS is making considerable progress toward slowing the transmission of HIV from pregnant women to their children and preventing the spread of tuberculosis. Similarly, childhood immunization rates are at record high levels, but a substantial number of children in the United States are not adequately protected from vaccine-preventable diseases. Further immunization work will continue this year to help ensure that no child, adolescent, or adult will needlessly suffer from a vaccine-preventable disease. HHS continues to work with the Office of National Drug Control Policy to implement an effective drug strategy that will increase the number of individuals provided with effective substance abuse treatment. Programs such as Access to Recovery promote client choice, expand access to broad array of clinical treatment and recovery support services, including services provided by faith and community based programs, and increase the overall substance abuse treatment capacity. The programs listed highlight Departmental goals and measures representative of the Department's work to reduce the major threats to the health and well-being of Americans. Highlighted Programs
1a National Immunization Program Program Description The mission of CDC’s Immunization program is to prevent disease, disability, and death in children and adults through vaccination. Many life-threatening and/or debilitating infectious diseases, including diphtheria, measles, mumps, and pertussis, were once common in this country. Now, widespread use of vaccines, particularly among children, has resulted in continuing low levels of these diseases. Appropriate administration of safe and effective vaccines is one of the most successful and cost-effective public health tools in preventing disease, disability, and death and reducing economic costs resulting from vaccine-preventable diseases. To maintain this success, CDC provides national leadership in the ongoing effort to protect children and adults from vaccine-preventable diseases and to ensure the safety of vaccines. The responsibilities are many and varied to focus on the goal of ensuring that every person, of every age, in every part of the country is protected from vaccine-preventable diseases. CDC strives to ensure control of vaccine-preventable diseases by working with partners to develop national immunization policy, ensure high quality immunization services, increase community participation, education and partnerships, improve systems to monitor disease and vaccination coverage, and improve vaccines and vaccine use. Snapshot
1 Due to a shortage of vaccine and temporary change in recommendations, reported 3 doses from 2002 - 2003. Discussion of Results and Performance One of CDC’s immunization goals is to ensure that 2-year-olds are appropriately vaccinated. New cases of most vaccine-preventable disease have decreased approximately 99 percent from peak pre-vaccine levels, which have saved lives and reduced treatment and hospitalization costs. As CDC’s immunization activities increase childhood immunization coverage, the incidence of vaccine-preventable diseases declines significantly. Vaccination coverage levels are at 90 percent or higher for most individual vaccines such as measles, polio, Haemophilus influenzae type b (Hib), and hepatitis B. Examples of the success of immunizations include:
The target of 90 percent coverage was met in 2004 for most of the vaccines, except for varicella and Diphtheria-Tetanus-Pertussis (DTaP) containing vaccine. In 2004, the coverage rate for four doses of DTaP did not achieve the 90 percent goal. In 2002 and 2003, CDC modified reporting on the measure for DTaP from four doses to three doses because vaccine shortages limited the availability of the fourth dose to children. This change was made because the Advisory Committee on Immunization Practices (ACIP) recommends that if this vaccine is in short supply, or not available, the fourth dose of DTaP may be dropped. The first three doses are considered the most critical to prevent disease. The change was temporary and reporting for the fourth dose has now been implemented. The coverage rate for the fourth dose has increased steadily since the change to a four-dose schedule, as recommended by the ACIP in 1991. This goal will be difficult to achieve because it requires that the fourth dose be given to the child between 15 and 18 months of age. The administration of DTaP tends to coincide with regular well-baby visits through the third dose; however, the fourth dose does not, thus requiring a visit specifically for this purpose. Coverage rates are 96 percent for the first three DTaP doses. Although the first three doses are considered to be most critical, CDC and the ACIP feel strongly that the fourth and fifth doses are important for full vaccination. Varying state requirements for the four-dose vaccine schedule may have also led to a slower increase in coverage. In 2004, the coverage rate for varicella vaccine did not yet achieve the 90 percent goal. Varicella is the most recently introduced vaccine that has a measurable target. Varicella vaccination rates are rising with coverage at only 43 percent in 1998, and reaching 88 percent in 2004. CDC is close to meeting the 90 percent varicella vaccines coverage goal which is especially impressive this soon after the introduction of this particular vaccine, since a child that has already been exposed to chickenpox does not receive the varicella vaccine. Conjugate vaccines for the prevention of Hib are highly effective. Hib is no longer the leading cause of meningitis among children younger than 5 years of age in the United States. In 2001, the ACIP added pneumococcal conjugate vaccine (PCV) to the Recommended Childhood Immunization Schedule. Accountability for PCV performance targets begins in FY 2006. PCV already is impacting the incidence of invasive pneumococcal disease. According to a recently published study, the incidence of invasive pneumococcal disease was 77 percent lower among white children less than 2 years of age and 89 percent lower among African American children less than 2 years of age in 2002, as compared to the 1998-1999 averages. Overall, this vaccine is projected to prevent more than 1 million episodes of childhood illness and approximately 120 deaths among children annually. Data Reliability Data for the immunization coverage performance come from the National Immunization Survey (NIS), which uses a nationally representative sample and provides estimates of vaccination coverage rates that are weighted to represent the entire population nationally, and by region, state, and selected large metropolitan areas. The NIS was established to provide an ongoing, consistent data set for analyzing vaccination coverage among young children in the United States and disseminating this information to interested public health partners. The NIS uses random-digit dialing to find households with children aged 19 to 35 months. Parents or guardians are asked to provide verbally the vaccines with dates that appear on the child’s "shot card" kept in the home, and demographic and socioeconomic information is also asked. At the end of the interview, permission is asked to contact the child's vaccination providers. Providers are then contacted by mail to verify each child’s vaccinations. Program Assessments and Evaluations In response to the PART assessment, CDC is undergoing a comprehensive independent evaluation of the 317 grant program. An independent contractor will provide recommendations to improve the efficiency of the 317 grant program. The comprehensive evaluation has three phases. In phase one, the program mission, performance measures, and objectives, and how the mission and objectives are being implemented by CDC and grantees will be evaluated. In phase two, the operations and management procedures, including the grant allocation decision-making process, will be evaluated. In the final phase, the program efficiency and accountability will be evaluated, and methods for improving efficiency of management and operations will be identified. The independent evaluation will be completed in August 2006. Separate from evaluation activities initiated following the 317 grant program PART review, efforts are underway to improve the Vaccines for Children (VFC) program. CDC has initiated a business process improvement project to strengthen the efficiency and accountability of vaccine management systems. Once implemented, the new systems will ultimately automate and integrate vaccine ordering and management by centralizing distribution of all public purchased vaccines. Although the 317 grant program and the VFC program serve two distinct groups who would not otherwise be immunized, the project focuses on the vaccine delivery, program management, and service delivery functions of the VFC program, which are similar to the Section 317 immunization grant program. Thus far, a set of recommendations have been developed to improve the business processes. Business process improvements should result in improved efficiencies, accountability, and cost savings for the VFC program and the 317 grant program. PART Review and Recommendations The Section 317 Immunization Grant program received an Adequate rating through the PART review. Specifically, the PART assessment determined the program has strong management practices and was successful in improving vaccination coverage levels among children. The PART assessment identified the areas of program management and planning in order to improve the programs ability to demonstrate program outcomes and results. Specific PART recommendations for this program are:
Program improvements and management initiatives are underway to address each of these recommendations. 1b HIV/AIDS PREVENTION IN THE U.S. Centers for Disease Control and Prevention (CDC) Program Description HIV remains a deadly infection for which there is no cure. Over 500,000 Americans have died of AIDS and an estimated 1,039,000 to 1,185,000 are currently infected with the virus. CDC has been involved in the fight against HIV and AIDS from the earliest days of the epidemic and remains a leader in HIV/AIDS prevention and control. While HIV incidence has decreased substantially, from an estimated 150,000 new infections per year in the late 1980s, new infections remain unacceptably high at an estimated 40,000 per year. CDC, as the Federal agency charged with preventing HIV infection, works with an array of partners including other Federal agencies, state and local health and education departments, HIV prevention community-planning groups, academic institutions, community-based and other nonprofit groups, and the private sector. CDC's core set of HIV prevention activities includes surveillance, research, intervention, capacity building, and evaluation. Surveillance provides demographic, laboratory, clinical, and behavioral data that are used to identify populations at greatest risk for HIV infection. These data also help CDC estimate the size and scope of the epidemic. Snapshot
*CDC will continue to revise baseline and targets when data from more states with adequate HIV reporting systems are available.
Discussion of Results and Performance CDC's overarching goal in HIV is to reduce by 25 percent the number of new HIV infections in the U.S. as measured by the number of HIV infections diagnosed each year among people less than 25 years of age, from 2,100 in 2000 to approximately 1,600 in 2010. The following measures indicate CDC's progress toward achieving this overarching goal. HIV Diagnoses Among People Under 25 Years of Age: The number of HIV infection cases among persons under 25 years of age diagnosed each year is the best data available to monitor new HIV infections. HIV infections occurring in this group are likely to have been acquired recently and thus are a relatively good proxy measure of HIV incidence. In addition, these data enable CDC to look at yearly trends in a meaningful way. Data are from a national surveillance system that collects demographic, clinical, and behavioral information on all AIDS cases diagnosed in the U.S. as well as HIV cases diagnosed in states with HIV reporting requirements. FY 2004 targets were set when only 25 states had stable, confidential name-based HIV reporting. Beginning in 2006, data will be reported from 30 areas with confidential name-based HIV reporting. This measure continues to be refined and has undergone revisions in previously reported data. In 2003, there were 2,331 cases reported in 25 areas with confidential name-based reporting. Data for 2004 will be available in November 2005. Perinatally-Acquired AIDS: A dramatic reduction in perinatal (mother-to-child) HIV transmission cases has been noted in the U.S., a result of the widespread implementation of the Public Health Service recommendations made in 1994 and 1995. Recommendations included routinely counseling and voluntarily testing pregnant women for HIV, and offering zidovudine to infected women during pregnancy and delivery, and their infants post-partum. Further decreasing perinatal HIV transmission is one of four strategies included in CDC's Advancing HIV Prevention Initiative. To support this key strategy, CDC issued recommendations that clinicians routinely screen all pregnant women for HIV infection and that jurisdictions with statutory barriers to such routine prenatal screening consider revising them. Surveillance data reported through December 2003 show sharply declining trends in perinatal AIDS cases. This decline was strongly associated with increasing zidovudine use in pregnant women who were aware of their HIV status. More recently, improved treatment also has likely delayed onset of AIDS for HIV-infected children. With efforts to maximally reduce perinatal HIV transmission and increase treatment of those infected, the number of cases is likely to remain low. However, declines may be affected by treatment failures and missed opportunities to prevent transmission. Data for 2003 continues to show low levels of perinatally-acquired AIDS cases, from 90 in 2002 to 58 in 2003. Data for 2004 will be available in November 2005. Data Reliability Adult and Pediatric Confidential HIV/AIDS data collection systems vary between areas (e.g., name-based code, coded identifier, name-to-code data collection systems). On July 5, 2005, CDC sent a letter to all states and territories recommending that all states and territories adopt confidential name-based surveillance systems to report HIV infections. Currently 43 state and local health departments use confidential name-based reporting of HIV infection while 14 other state, territorial, and local health departments used code-based or name-to-code methods. The period of time between a diagnosis of HIV or AIDS and the arrival of a case report at CDC is called the "reporting delay". In order to provide the best estimates of trends in incidence, HIV and AIDS surveillance data are analyzed by the data of diagnosis and are mathematically adjusted in more recent periods to adjust for reporting delays and incomplete information on some cases. Program Evaluations In 2000, the Institute of Medicine reviewed CDC and other HHS Agencies’ HIV prevention activities to provide recommendations to CDC and other Agencies on how to improve their activities. Twice in the past 10 years, CDC has convened an external review panel to look at CDC’s existing activities and provide recommendations for the future. The first led to reorganization (merging surveillance with prevention programs), and the most recent one led to the current HIV prevention strategic plan. CDC also has some ongoing studies, including HHS’ Office of Inspector General audit of HIV prevention programs. PART Review and Recommendations CDC's domestic HIV/AIDS prevention program received a rating of Results Not Demonstrated from the PART review during the FY 2004 budget process. As a result of that review, CDC is working to implement the following action items:
CDC is working to implement the PART recommendations and reports regularly to OMB on achieving milestones established for each recommendation. 1c Substance Abuse Prevention and Treatment Block Grant Program Description The goal of SAMHSA’s Substance Abuse Prevention and Treatment Block Grant is to improve the health of the Nation by bringing effective alcohol and drug treatment and prevention services to every community through a block grant to the states. The effects of substance use disorders are seen in permanent damage to the Nation’s children, the transmission of HIV/AIDS and other communicable diseases, criminal involvement, premature and preventable deaths, and economic and social consequences estimated to cost the Nation more than $2941 billion per year. The block grant supports and expands substance abuse prevention and treatment, while providing maximum flexibility to the states. States and territories may expend block grant funds only for the purpose of planning, carrying out, and evaluating activities related to these services. The block grant is the cornerstone of states’ substance abuse programs and is an integral part of the President’s drug treatment initiative. States are heavily dependent upon block grant funding for urgently needed substance abuse services. Snapshot
[1] Source: SAMHSA, Office of Applied Studies. Treatment Episode Data Set (TEDS): 1992-2001. National Admissions to Substance Abuse Treatment Services, Drug Abuse Services Information System (DASIS) Series: S-20, HHS Publication No. (SMA) 03-3778, Rockville, MD, 2003. p. 79. (Issued as proxy for this measure) Results and Performance Although the FY 2001 and 2002 targets for increasing the number of clients served were exceeded, the FY 2003 target was missed slightly. Data collected by the Drug Abuse Services Information System-Treatment Episode Data Set (DASIS-TEDS) information system showed SAMHSA served 1,840,275 clients in FY 2003, about 2 percent below the target. FY 2003 is the most recent year for which data are currently available, because of the time required for states to report data on the number of admissions in any given year. FY 2004 data will be available in October 2006, and FY 2005 data will be available in October 2007. DASIS-TEDS is a proxy for this measure, representing treatment admissions rather than the total number served. This measure is one of SAMHSA’s National Outcome Measures, which, when fully implemented by the end of FY 2007, will provide more direct and accurate data on number of clients served by reporting an unduplicated count of clients. The unduplicated reporting will be phased in among the States. As States begin to report unduplicated counts, DASIS-TEDS might show that that the number of admissions has gone down, since readmissions of the same individual in the reporting period would be counted as a single client served. Targets may be adjusted to reflect this change. Data Reliability The proxy data reported represent treatment admissions data. These data are used as a proxy for persons served because many states currently are unable to employ a unique client identifier, which is necessary in order to track unduplicated numbers of clients served. States are working toward providing unduplicated counts of the number of clients served. SAMHSA expects that the 2004 and 2005 goals will be met. Limitations to DASIS-TEDS data fall into two broad categories: those related to the scope of the data collection system (e.g., the fact that DASIS-TEDS collects data on admissions rather than individuals), and those related to the difficulties of aggregating data from highly diverse state data collection systems. A more detailed discussion of data limitations is available at http://www.nationaloutcomemeasures.samhsa.gov/new_reserve/teds.asp#teds_limitations The following external factors affect the performance of the block grant:
Program Assessments and Evaluations The block grant received a PART rating in the FY 2005 budget cycle of Ineffective. The review identified strengths, such as program purpose, need for program, and program design. The review identified a number of areas for improvement, with the main area related to performance measures. The assessment found that SAMHSA faces continuing challenges in collecting performance data. SAMHSA will address this problem over time by implementing the National Outcome Measures, and has established the goal of all states reporting on all National Outcome Measures by the end of FY 2007. At that point, the data source will change to the State Outcomes Measurement and Management System, which will collect data on all the National Outcome Measures. An evaluability assessment of the Substance Abuse Prevention and Treatment Block Grant was completed in December 2004. A comprehensive evaluation is under development, with results expected in late 2006. Strategic Goal 2Enhance the Ability of the Nation’s Health Care System to Effectively Respond to Bioterrorism and Other Public Health Challenges HHS has a number of initiatives and programs directed at protecting Americans from bioterrorist attacks and other public health challenges. The events of September 11, 2001, and subsequent anthrax attacks have reinforced the lead role HHS plays in protecting Americans from attacks on the Nation’s health and food supply. The HHS role in enhancing the Nation’s level of preparedness and overall response capabilities is absolutely vital to helping maintain vigilance and security. The Office of Public Health Emergency Preparedness (OPHEP) was established to direct the Department's efforts in preparing for, protecting against, responding to, and recovering from bioterrorism and other public health emergencies that could affect the civilian population. OPHEP serves as the focal point for these activities, directing and coordinating the development and implementation of a comprehensive HHS strategy. Several OPDIVs have major rolls in helping meet this strategic goal. The Food and Drug Administration works to provide responsive regulatory review of new biodefense medical countermeasures and plays a major role by inspecting high-risk domestic food manufacturers and enhancing food import inspections to protect our Nation's food supply and prevent food borne illness. The Health Resources and Services Administration works to prepare hospitals and other medical facilities for health consequences of bioterrorism and other mass casualty events. The Centers for Disease Control and Prevention has played an integral role in strengthening state and local public health infrastructure to respond effectively to emergencies. The measures described in this section are representative of progress HHS has made in building the necessary infrastructure to respond to bioterrorist and other public health challenges. Highlighted Programs
2a Field Foods Program Program Description FDA’s Prior Notice Center (PNC) was established in response to regulations promulgated in conjunction with the Public Health Security and Bioterrorism Preparedness Act of 2002. Its mission is to identify imported food products that may be intentionally contaminated with biological, chemical, or radiological agents, or which may pose significant health risks to the American public, from entering into the United States. The PNC targets food and animal feed commodities that have been identified as high-risk based on either threat assessments that have been conducted or the receipt of specific intelligence indicating the items may cause death or serious injury due to terrorism or other food related emergencies. Snapshot
Results and Performance This is a new goal since the Bioterrorism Act became effective in December 2003. In FY 2005, FDA achieved this goal by collaborating with the Department of Homeland Security’s Customs and Border Protection to direct field personnel to conduct 86,187 intensive security reviews of prior notice submissions in order to intercept contaminated products before they entered the food supply. This exceeded the FY 2005 target by 48,187. However, it should be noted that the import security reviews that are performed by the Prior Notice Center are performed on all prior notice submissions that are selected after intelligence, known risk factors, and information available about the shipper and consignee are applied to the prior notice submission data. FDA is not able to know in advance how many of the prior notices submitted will need to have a security review since the candidates are not selected in relation to the volume of submissions; they are selected on the basis of risk factors. The 38,000 estimate of the number of security reviews to be performed was simply an estimate based on the first 6 months of the Prior Notice Center's operation in FY 2004. Data Reliability The reliability and completeness of the prior notice security review can be assessed at each level of the review process described in the Data Validation segment. The first step is to ensure that the prior notice minimally contains data for all the required fields while the next step subjects the data to a series of validation edits. These two steps are entirely electronic and are ascertained for accuracy routinely by the contractors. Adjustments to the editing and rejection process can be tested on the reporting data for effectiveness prior to implementation. Likewise, the segregation of high-risk products from the entire pool of prior notice submissions involves establishing electronic criteria that target and mark elements of the prior notice data that coincide with intelligence and prevailing risk assessments. The manual review of prior notice information involves the evaluation and assimilation of the adequacy, accuracy, and risk assessment of the shipment by a PNC Reviewer. When a shipment is associated with a Treasury Enforcement Communication System (TECS) record that involves terrorism or a terrorist action or the research cannot discount a terrorist or public health concern, the prior notice data are brought to the attention of a PNC Watch Commander or supervisor. The information is vetted in conjunction with CBP using internal, external and classified sources. If possible terrorist activity or public health concerns cannot be discounted at this level, the situation is brought to the attention of the PNC Deputy Director, and/or PNC Director, and/or the Director of the Division of Import Operations and Policy. Regardless, the Reviewers complete a research sheet and check list for each shipment that they review. Program Assessments and Evaluations The PNC was established in December 12, 2003, and began its operations under a period of enforcement discretion of the prior notice requirements. Since that time, major changes in the enforcement of the prior notice elements were coupled with changes in the electronic processing and analysis of the prior notice and introduced to the import community in stages. Since the quality of the prior notice data and the effectiveness of the computer processing and analysis are directly tied to the review process, FDA’s methods of conducting risk-based assessments have evolved. Although the basic threat assessment matrix and determination process has not changed, the accuracy and quantity of the data obtained in the prior notice itself and from research sources has improved. In addition, recent enhancements in the specificity of the screening criteria improve the ability to target, review and respond to dynamic and emerging public health threats. FDA was evaluated as an entire Agency during the FY 2005 PART assessment and achieved an overall rating of Moderately Effective. 2b National Bioterrorism Hospital Preparedness Program Program Description The goal of the Bioterrorism Hospital Preparedness program, which is part of the President’s Homeland Security Initiative, is to ready hospitals and supporting health care entities to deliver coordinated and effective care to victims of terrorism and other public health emergencies. The Nation has lacked adequate plans and infrastructure to respond to challenges that terrorist acts and other events with mass casualties may pose. A GAO investigation (Report 03-373), conducted late in 2002, found widespread deficiencies in capacity, communication, and coordination elements essential to preparedness and response. The Hospital Preparedness program, established in FY 2002, enables state and regional planning among local hospitals, emergency medical services systems, health centers, poison control centers, and other health care facilities, to improve their capability to respond to the healthcare consequences of terrorist attacks and address infectious disease epidemics and other mass public health emergencies. This program works in concert with CDC’s Public Health Emergency Preparedness program and the Metropolitan Medical Response System program of the Department of Homeland Security. Snapshot
[1]This program was established in FY 2002. Plans for surge capacity must address the following issues: (1) hospital bed capacity for adults and children; (2) the capability for isolation and decontamination; (3) appropriate staffing; (4) appropriate medical prophylaxis and treatment for hospital staff and their family members; (5) personal protective equipment; (6) capacity for trauma and burn care; (7) capacity for mental health care; (8) communications and information technology and (9) hospital laboratory connectivity and capacity. By FY 2005, 100 percent of Hospital Preparedness program awardees had developed surge capacity plans. This represents an increase from 89 percent in FY 2004. In the future, the program will track various aspects of the implementation of these plans. 2c Terrorism Preparedness and Emergency Response Program (Strategic National Stockpile) Program Description The health and security of the United States depends on our preparedness against terrorism. CDC’s mission in this area is to prevent death, disability, disease and injury associated with urgent health threats. CDC contributes to the enhancement of the Nation’s public health care ability to effectively respond to bioterrorism and other public health challenges by:
Another key mechanism for advancing national preparedness is the bioterrorism preparedness cooperative agreement awarded to 62 state and local grantees. CDC's comprehensive terrorism preparedness and emergency response program comprises three key components: Detection activities assure the ability to detect an event so intervention can begin as early as possible to minimize mass trauma; Investigation and response activities ensure plans and systems are in place to respond to and investigate a public health event; and Control, containment, and recovery activities ensure, among other activities, state and local government's ability to receive and distribute the Strategic National Stockpile, a national repository of life-saving pharmaceuticals, medical material, and equipment. CDC, through the Strategic National Stockpile (SNS), acquires, manages and deploys the Nation's stockpile of life saving pharmaceuticals and other medical assets for a response to a terrorist event or other type public health emergency. Portions of the stockpile are configured in 50-ton, 12-Hour Push Packages that contain supplemental medicine and medical supplies designed to be deployed rapidly and used in the event of mass casualty incidents. These packages can be delivered to any point in the country within 12 hours. Additionally, SNS assists state and local planners with the receipt, staging, storage, distribution and dispensing of SNS assets. Snapshot
Discussion of Results and Performance The FY 2005 target for the measure is that 25 percent, or 15 states/territories/grantees, will conduct an exercise to evaluate their plans and response systems. As of November 2004, 100 percent of grantees have written response plans that cover at least one of the Category A biological agents and chemical agents. As of May 2005, 94 percent (47/50) of state public health agencies have exercised the plan for at least one of these priority agents. In future years, grantees will need to implement corrective actions within 90 days of identifying a deficiency through a drill, exercise, or real event. CDC, in A Guide for Preparedness, V 10.00, describes 12 functions of SNS Preparedness required for the effective management and use of deployed SNS materiel. Based on these functions, grantees are required to develop SNS Preparedness Plans detailing the performance of these functions during an emergency. In an effort to enhance grantee SNS preparedness planning efforts, the SNS Program maintains a staff of Program Services Consultants who provide ongoing technical advice and training assistance to grantees. The Program Services Consultants also evaluate the grantee’s level of preparedness to receive, distribute and dispense SNS assets. As of the third quarter of FY 2005, 78 percent (42/54) of the states and directly-funded cities have met the minimum standards for demonstrating preparedness to use SNS assets and thus received a rating of amber or better. Data Reliability Currently, states self-report performance information. Plans for validation of self-reported data are under development. Program Evaluations CDC’s Terrorism program, through its Coordinating Office for Terrorism Preparedness and Emergency Response, coordinates in-depth evaluations initiated by GAO, and the Office of Evaluation and Inspections (of the HHS Office of the Inspector General). CDC reports on program status and progress, and uses recommendations to evaluate/improve program effectiveness. Audits and evaluations broadly focus on each component of public health preparedness to include: workforce development, surveillance and epidemiology, laboratory capacity, communication, funding management and accountability, disease reporting systems, and the Strategic National Stockpile. PART Review and Recommendations CDC’s Division of State and Local Readiness received a rating of Results Not Demonstrated from the PART review during the FY 2005 budget process. As a result of the PART assessment, the program is implementing an independent program evaluations to inform strategic planning and program management and to link performance and measures. CDC is working to implement additional recommendations for continued program improvement. Strategic Goal 3:Increase the Percentage of the Nation’s Children and Adults Who Have Access to Health Care Services, and Expand Consumer Choices The Department is working to expand health care to all and remains committed to its many efforts aimed at increasing the percentage of the Nation's children and adults who have access to care and expanding consumer choices. The Department will also continue to promote increased access to health care for uninsured and underserved people and for those whose health care needs are not adequately met by the private health care system. In support of this goal, HHS will continue to promote a wide variety of activities intended to increase access to health care, encourage the development of low-cost health insurance options, reduce health disparities, and to strengthen and improve health care services for targeted populations with special health care needs. HHS is committed to raising awareness among minority communities about major health risks prevalent in their specific populations and providing access to information on how to reduce these risks. This commitment also includes efforts to promote cultural competence among practitioners, thereby reducing communication barriers between health care providers and their patients. HHS will continue to conduct and support research to find underlying causes of racial and ethnic health disparities and develop and disseminate effective strategies to reduce them. Highlighted Programs
3a Health Centers Program Program Description Health centers are a major component of America’s health care safety net for the Nation’s indigent, underserved, and vulnerable populations. This program, which is nearly 40 years old, is a Presidential initiative to increase health care access for those Americans most in need. Millions of Americans are uninsured and lack access to a regular source of health care. These and others also face non-financial barriers to receipt of appropriate care. Health centers provide regular access to high quality, family-oriented, and comprehensive primary and preventive health care regardless of patients’ ability to pay while also reducing other barriers to care. The ultimate goal of Health centers is to contribute to improvements in the health status of underserved and vulnerable populations and to the elimination of health disparities. The program provides grants to a variety of community-based public and private nonprofit organizations for the operation of health centers. These grants provide about 25 percent of health centers’ revenues on average, leveraging $3 for each Health Centers program dollar spent. Snapshot
Results and Performance The President’s Health Centers initiative began in FY 2002 with the goal of creating 1,200 new or expanded health center sites and increasing the number of clients served by 6.1 million. A critical element in expanding access to care for the Nation’s most vulnerable populations is the establishment of new health center sites and the expansion of existing sites to provide required facilities, personnel and services, particularly in communities of greatest need. In the first 4 years of the initiative, FY 2002-FY 2005, the program funded 777 new or significantly expanded sites, exceeding the target each year. This total does not include the FY 2006 expansion sites in areas affected by Hurricane Katrina that received accelerated partial funding in September 2005 to initiate the expansions as quickly as possible. Growth in the number of persons served by health centers is an indicator of expanded access to care for the Nation’s most vulnerable populations. Health centers served 13.1 million persons in 2004, achieving more than 99 percent of its target even though it generally takes several years for newly established sites to become fully operational. This represented a growth of more than 730,000 persons over the previous year and growth has increased by nearly three million persons since the beginning of the President’s initiative. Access to care is key to eliminating health disparities. The number of racial/ethnic minority individuals served by Health Centers increased from 7.9 million in 2003 to 8.3 million in 2004, continuing a steady growth consistent with the overall growth in program clients. The proportion of racial/ethnic minority individuals has remained steady at 64 percent of total clients, only one percentage point below the target of 65 percent. Maintaining steady percentages of the Nation’s most vulnerable is an important achievement given the growth in the program. The President’s Health Centers initiative includes expansions for existing centers and development of new service sites. Some of these new sites are or will be in underserved rural areas that do not have large numbers of racial/ethnic minorities. The substantial and rapid increases in the total number of clients served and expansions in areas with relatively small proportions of racial/ethnic minorities impact the program’s ability to maintain and increase the proportion of minority clients served. Therefore, a racial/ethnic minority representation of 65 percent of the Health Centers’ total client population is a challenging performance target. Data Reliability A broad range of performance information for the Health Centers program is collected through five principal means: (1) a Uniform Data System collects aggregate administrative, demographic, financial, and utilization data annually from each organization receiving support; (2) information from Health Disparities Collaboratives which includes data on chronic disease treatment and outcomes collected from health centers participating in formal collaboratives to improve quality of care; (3) periodic surveys of a representative sample of health center patients to provide in-depth information on individuals and the care they receive, comparable to the National Health Interview Survey and the National Hospital Ambulatory Medical Care Survey; (4) Sentinel Centers Network data on patient and provider characteristics obtained from a representative group of HRSA-supported health centers; and (5) occasional special evaluation studies. Uniform Data System data are validated through edit checks and onsite reviews conducted during each organization’s project period. All data collection tools have edit checks for internal consistency. To assure representativeness of Sentinel Centers Network and survey data, sociodemographic and organizational characteristics are compared with the Uniform Data System reporting. Program Assessments and Evaluations The HHS Office of Inspector General conducted a survey of risk management activities at health centers in FY 2005 (OEI-01-03-00050). The survey results indicated that health centers identified staff training, patient tracking, and peer review as the three most difficult risk management practices to carry out. Lack of financial resources for risk management, lack of a dedicated staff person for risk management, and lack of training were cited as key challenges to conducting risk management. In its response to this report, HRSA identified a goal that by 2010, 100 percent of health centers will participate in structured risk management activities as a strategic element for improving health care quality. Activities aimed at achieving this goal may include holding risk management workshops and developing a comprehensive training agenda. An article by O’Malley et. al analyzed Health Centers’ most recent visit survey compared to the one conducted in 1994. The study revealed that the number of patients continued to increase and the visit rate per patient was sustained. Continuity of care also improved and there were no disparities in preventive services delivery by race/ethnicity or insurance status. The authors concluded that continued growth under the Presidential initiative is likely to help reduce health disparities and improve care for the underserved. (O'Malley, A., et al. Health Center Trends, 1994-2001: What Do They Portend for the Federal Growth Initiative? Health Affairs, 2005; 2(24(2):465-472.) 3b National Diabetes Program Program Description The IHS Division of Diabetes Treatment and Prevention is an integral part of the IHS Hospitals and Health Clinics program. The mission of the IHS Division of Diabetes Treatment and Prevention (DDTP) is to develop, document, and sustain a public health effort to prevent and control diabetes in American Indian/Alaska Native (AI/AN) people. The program works with communities to prevent and treat diabetes, in addition to overseeing the Special Diabetes Program for Indians grant program (SDPI). Development of the regional Model Diabetes programs is a major achievement of the IHS DDTP. The Model Diabetes programs are designed to expedite care and provide education to people with diabetes, and to translate and develop new approaches to diabetes control that serve as models for other Indian communities facing similar problems. Area diabetes consultants within each IHS Area provide consultation and technical assistance related to clinical activities and programmatic issues to Indian, Tribal, and Urban facilities and SDPI programs. This ongoing emphasis on diabetes care within IHS’ Hospital and Health Clinics budget recognizes the role of diabetes as a major cofactor in morbidity and as well as one of the major causes of mortality among AI/AN people. Meeting performance indicators in this program reflects an increase in the percentage of AI/AN patients who have access to quality clinical care within the IHS system. Snapshot
Results and Performance The FY 2004 indicator was to increase the proportion of AI/AN patients with diabetes that have improved glycemic control by 1 percent. IHS met and surpassed this target. The 2004 performance enabled IHS to improve the FY 2003 performance level for ideal glycemic control in patients with diagnosed diabetes by 3 percent. Two data sources (the diabetic audit of glycemic control as well as an electronic health information system application [Clinical Indicator Reporting System]) provide reliable and consistent performance information; the diabetic audit of over 33,000 diabetic patients substantiates the electronic Clinical Reporting System audit of over 74,000 diabetic patients. Glycemic control refers to how well blood sugars are controlled in a person with diabetes. It is measured with a blood test called the Hemoglobin A1c. The IHS Diabetes Care and Outcomes Audit process divides these levels of control into “Ideal” (<7 percent); “Good” (7.0-7.9 percent); “Fair” (8.0-9.9 percent); “Poor” (10-11.9 percent); and “Very Poor” (>12 percent) categories, based on national diabetes care standards. The graph below illustrates IHS’ ongoing ability to improve glycemic control in AI/AN populations, as well as improve the percentage of patients in ideal control. 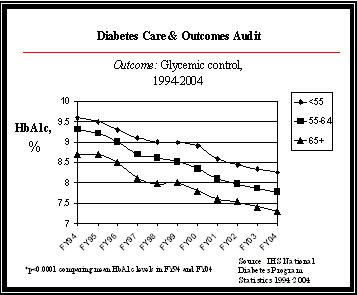
HbA1c measures the glucose level (sugar content) of a patient's blood. A lower HbA1c percentage indicates better blood sugar control. This graph illustrates improving glycemic control among the IHS population, broken into age categories for patients 55 years and older, and among the population as a whole. IHS uses several treatment and prevention strategies to achieve glycemic control in the AI/AN population:
IHS targets continue to be ambitious in overcoming the diabetes epidemic in AI/AN populations. There is a historical and projected annual increase in diabetic prevalence of 4 percent. Since 1997, the number of patients with diabetes served by the Indian, Tribal, and Urban system has increased by 45 percent, according to a review of diabetes program data by diabetes statisticians. Data Reliability Data for this review is obtained from the annual IHS Diabetes Care and Outcomes Audit. In FY 2004, more than 33,000 charts were reviewed as part of the diabetic audit throughout all 12 Areas. IHS, Tribal, and Urban clinical facilities are encouraged to maintain diabetes registries of all persons with diabetes. Selected clinical variables and interventions are collected annually using a systematic random sample of charts at each facility. In short, a sample size is chosen for each facility that is sufficient to provide an estimate within ten percent of the true rate of adherence for each facility with a confidence of > 90 percent. The abstracted data are then entered into a general-purpose microcomputer-based software program. Data are collected following standardized protocols using fixed definitions and data collection forms. While validation studies of the audit have not been published, some IHS areas have implemented additional audits using different reviewers to audit the same charts and to assure accuracy in data entry procedures. In addition, a comparison study has shown good observed agreement between the manual and electronic audits (0.78 percent - 1.00 percent) at a particular site. Additional information on the audit is available at: http://www.ihs.gov/generalweb/webapps/sitelink/site.asp?link=http://www.dmaudit.com/. The Clinical Indicator Reporting application, a part of RPMS (the IHS Health Information Technology solution) conducts an extensive electronic audit of the diabetic user population. This application is used throughout the facilities to evaluate clinical quality, and includes a sub report on diabetes. In FY 2004, over 78,000 diabetic charts were electronically reviewed. Further information is available at: http://www.ihs.gov/cio/crs/. Program Assessments and Evaluations During the FY 2004 budget process, the IHS PART included a review of the IHS Direct Federal programs and the Hospital and Clinics Budget, where the funding for diabetes care resides. The program received a rating of Moderately Effective. IHS shared the PART review results with the clinical providers and healthcare facilities, where quality care improvements are operationalized. These improved trends in diabetes care demonstrate the public health impact made possible when local, program, and Departmental initiatives are focused on a common outcome. The PART review process also has focused attention on the continued importance of assuring valid and reliable performance data addressing diabetic care at all levels of the Indian health system (i.e., IHS, Tribal and Urban); performance data collection, thus, was addressed in both the Urban Indian Health Program and RPMS/IT PART reviews during the FY 2005 budget process. The FY 2006 Facilities PART included this measure as one of its annual and long-term strategic goals for illustrating the impact of new facilities on the health status of communities. The FY 2007 Tribally Operated Health Facilities include this measure as one of the elements of its composite results measure. 3c.1 Medicaid and the State Children’s Health Insurance Program (SCHIP) Program Description Medicaid is a means-tested health care program for low-income Americans, administered by CMS in partnership with the states. It is the primary source of health care for a large population of medically vulnerable Americans, including poor families, the disabled, and persons with developmental disabilities requiring long-term care. In coordination with the Medicaid program, the State Children’s Health Insurance Program (SCHIP) has stimulated enormous change in the availability of health care coverage for children. SCHIP was created through the Balanced Budget Act of 1997 to address the fact that nearly 11 million American children (one in seven) were uninsured and at increased risk for preventable health problems. This program represents the largest single expansion of health insurance coverage for children in more than 30 years and improves the quality of life for millions of vulnerable children less than 19 years of age. Many of these children were in working families that earned too little to afford private insurance on their own, but too much to be eligible for Medicaid. The funds allocated for SCHIP cover insurance costs, reasonable administrative costs, and outreach services to get children enrolled. Title XXI of the Social Security Act gave states the option to expand their Medicaid program, establish a separate SCHIP, or use a combination of both. CMS’ goal is to increase the number of children (up to age 19 for SCHIP; age 21 for Medicaid) enrolled in regular Medicaid or SCHIP. Snapshot
Results and Performance While this goal focuses on enrolling children in Medicaid and SCHIP rather than on measuring un-insurance rates, there is overwhelming evidence that the rate of un-insurance in children has been reduced since the inception of SCHIP. CMS continues to work with states to assure that their programs are designed to best meet the needs of their children and provides extensive technical assistance to states that need to modify their programs. In an effort to address budget issues, some states have submitted amendments to increase cost sharing, reduce benefits, reduce the period of coverage from 12 to 6 months, and other programmatic changes, which may lead to decreases in enrollment for some states. CMS has also approved SCHIP state plan amendments to allow some states to implement an enrollment cap and/or waiting list. However, as the budget situation improves some states are making plans to remove these enrollment caps and/or waiting lists and decrease enrollee cost sharing. In addition, many states have eliminated barriers that prevent families from enrolling in Medicaid and SCHIP. For example, many states have simplified application forms and eliminated income verification requirements. Data Reliability The program enrollment data that States submit through the Statistical Enrollment Data System are reviewed by CMS every quarter. CMS will measure, to the extent possible, the unduplicated count of the number of children who are enrolled in any of the following programs: regular Medicaid; expansions of Medicaid through SCHIP; and separate SCHIP programs as reported by the States. While CMS considers an unduplicated count to be an appropriate measure for this goal and the unduplicated count we can be measured within each program, some children may be enrolled in Medicaid at one point in the year and in SCHIP at another point, making it difficult to establish an accurate unduplicated count across all programs. Similarly, the SCHIP counts include some double counting of children in States that have combination programs. To the extent the data allows, CMS will closely monitor this issue. The data for this goal are complete and reliable. This program is audited through the CMS Chief Financial Officer audit. Program Assessment and Evaluations There are no program evaluations pertaining to enrollment planned for FY 2005. Program Assessment Rating Tool (PART) - SCHIP was initially assessed using PART in the FY 2004 cycle and was reassessed as Adequate in the FY 2005 cycle. As a result of the PART findings for FY 2004, CMS developed an SCHIP Action Plan to address certain concerns. CMS continues to develop with states a core set of national performance measures to evaluate the quality of care received by low-income children. A new annual performance goal was established to utilize the information gathered with states to establish formal collaborations that will improve health care delivery and quality for Medicaid and SCHIP populations using reliable and valid performance measures. In addition, CMS expanded the Payment Error Rate Measurement (PERM) program developed to measure and ultimately reduce Medicaid and SCHIP payment error rates, beginning with the Medicaid Fee-For-Service component in FY 2006. 3c.2 Medicaid and the State Children’s Health Insurance Program (SCHIP)Centers for Medicare & Medicaid Services Program Description Because of the Federal-state partnership in the Medicaid and SCHIP programs, improvements in the use of performance measures to improve health care quality are best accomplished if jointly identified by CMS and states. As part of the Performance Measurement Partnership Project (PMPP), seven HEDIS� measures were proposed by a work group of state Medicaid and SCHIP officials as performance indicators that states would report annually on a voluntary basis. The following are the seven proposed performance measures (SCHIP-related measures in italics): Adult access to preventive/ambulatory health services; Children’s access to primary care practitioners; Comprehensive diabetes care (HbA1c tests); Prenatal and postpartum care (prenatal visits); Use of appropriate medications for children with asthma; Well child visits for children in the first 15 months of life; and Well child visits in the 3rd, 4th, 5th, and 6th years of life. Snapshot
Results and Performance A data collection tool for states to voluntarily report measurement data on the core set of performance measures as a pilot test was developed and was cleared by OMB in May 2004. Results from the initial data collection effort will support continued technical assistance to states to improve state reporting capability and encourage voluntary reporting of performance measurement data by additional states. Medicaid: The project contractor has completed analysis of the feasibility of using Medicaid Statistical Information System (MSIS) data to calculate the Medicaid performance measures. Results from two states targeted for specific reporting analysis suggest that MSIS can be used to calculate a current set of performance measures in states with predominantly fee-for-service Medicaid programs. However, it is recommended that use of MSIS be delayed until MSIS is fully populated with standardized HIPAA compliant data. SCHIP: CMS began collecting SCHIP performance measures through the SCHIP annual reports beginning in FY 2003. CMS revised the SCHIP state annual report template in FY 2003 to include the core measures for states to report, to the extent they have data available. CMS received and analyzed the FY 2003 SCHIP annual reports from all states. CMS also amended a contract to enhance the reporting of quality performance measurement for SCHIP, in preparation for the FY 2004 annual reports. Data Reliability The program enrollment data that States submit through the Statistical Enrollment Data System are reviewed by CMS every quarter. CMS will measure, to the extent possible, the unduplicated count of the number of children who are enrolled in any of the following programs: regular Medicaid; expansions of Medicaid through SCHIP; and separate SCHIP programs as reported by the States. While CMS considers an unduplicated count to be an appropriate measure for this goal and the unduplicated count we can be measured within each program, some children may be enrolled in Medicaid at one point in the year and in SCHIP at another point, making it difficult to establish an accurate unduplicated count across all programs. Similarly, the SCHIP counts include some double counting of children in States that have combination programs. To the extent the data allows, CMS will closely monitor this issue. The data for this goal is complete and reliable. This program is audited through the CMS Chief Financial Officer audit. Program Assessment and Evaluations SCHIP: A contractor will prepare an analysis of the state-reported core performance measures by the end of FY 2005. Medicaid: An independent CMS contractor will prepare the evaluation of this activity. Program Assessment Rating Tool SCHIP was initially assessed using the PART in the FY 2004 cycle and was reassessed as Adequate in the FY 2005 cycle. As a result of the PART findings for FY 2004, CMS developed an SCHIP action plan to address certain concerns. CMS continues to develop with states a core set of national performance measures to evaluate the quality of care received by low-income children. A new annual performance goal was established to utilize the information gathered with states to establish formal collaborations that will improve health care delivery and quality for Medicaid and SCHIP populations using reliable and valid performance measures. In addition, CMS expanded the Payment Error Rate Measurement program developed to measure and ultimately reduce Medicaid and SCHIP payment error rates, beginning with the Medicaid Fee-For-Service component in FY 2006. 3d Medicare Program Description The Medicare Prescription Drug, Improvement, and Modernization Act (MMA) of 2003, as signed by the President on December 8, 2003, provides Medicare beneficiaries access to prescription drug coverage and the buying power to reduce the prices they pay for drugs. The Act provides enhanced coverage for the lowest income beneficiaries and an immediate prescription drug discount card for all people with Medicare. People with Medicare without drug coverage are now eligible for the Medicare-endorsed Prescription Drug Discount Card, which began operation six months after enactment and continues until the full benefit is implemented. The card program is estimated to save beneficiaries between 10 to 25 percent on most drugs. Those with incomes below 135 percent of poverty will be given immediate assistance through a Medicare-endorsed prescription drug discount card with $600 annually applied toward purchasing their medications. Snapshot
Results and Performance Medicare beneficiaries began signing up for drug cards on May 3, 2004, with discounts beginning June 1, 2004. Since early June 2004, there has been steady growth in beneficiaries signing up for the card. Enrollment reached the 6.25 million mark on March 31, 2005. This breaks out to 2.53 million in exclusive cards and 3.72 in general cards. Of the more than 6 million who are enrolled, approximately 4.47 million are enrolled in the drug card only, and 1.77 million are receiving the $600 low-income credit in conjunction with their drug discount card. Currently, 37 organizations provide a total of 68 distinct general and special endorsement drug discount cards; 35 cards are national and 33 are regional. In addition, CMS has amended more than 90 Medicare Advantage contracts to include exclusive cards. Data Reliability The data for this goal are complete and reliable. CMS is the owner of all enrollment data for the Drug Card Program, therefore, the CMS system is the definitive record of enrollment. Moreover, CMS sends monthly enrollment reports to all Drug Card sponsors. The sponsor reconciles their enrollment files against the CMS monthly enrollment reports, and any discrepancies are corrected. This verification process confirms the reliability of the data. Program Assessment and Evaluations No independent evaluations. 3d.2 Medicare Program Description The CMS administers Medicare, the Nation's largest health insurance program, which provides health insurance to people age 65 and over, those who have permanent kidney failure, and certain people with disabilities. Since its inception, this program has helped pay medical bills for millions of Americans, providing them with comprehensive health benefits they can count on.Assuring health care security for beneficiaries is CMS’ primary mission. CMS strives to encourage choice in the Medicare beneficiary community for medical coverage while maintaining high-quality care and ensuring fairness of the program to its beneficiaries. Snapshot
Results and Performance CMS baselines for both Managed Care and Fee-For-Service satisfaction are already fairly high. Given this type of survey for a large group of people and considering the unrelated factors that could influence responses, CMS knows that a target of 100 percent satisfaction is unrealistic. Nonetheless, the targets are challenging and are set for a 5-year period in order for the percentage increases to be large enough to be statistically detected. In response to the need to standardize the measurement of and monitor beneficiaries’ experience and satisfaction with the care they receive through Medicare, CMS developed a series of data collection activities under the Consumer Assessment Health Plans Surveys (CAHPS). CMS fields these surveys annually to representative samples of beneficiaries enrolled in each Medicare Managed Care plan, as well as those enrolled in the original Medicare Fee-For-Service plan. CMS provides comparable sets of specific performance measures collected in CAHPS to its partners and stakeholders. Data from the target year (FY 2005) for the access to care/specialist measures will be available July 2006. Data Reliability The Medicare CAHPS are administered according to the standardized protocols as delineated in the CAHPS 2.0 Survey and Reporting Kit developed by AHRQ. Program Assessment and Evaluations This activity did not undergo an independent evaluation in FY 2005. 3e Quality Improvement Organizations Program Description Under the Quality Improvement Organization (QIO) program, CMS maintains contracts with independent physician organizations to ensure that medical care paid for under the Medicare program is reasonable and medically necessary, meets professionally recognized standards of health care, and is provided in the most economical setting. The QIO responsibilities are specifically defined in the portion of the contract called the Statement of Work (SOW). Each SOW is 3 years in duration and may vary the activities the QIOs perform. The QIO program is funded directly from the Medicare trust funds. Snapshot
Results and Performance In recent years, there have been influenza vaccine shortages and distribution delays, which have impacted the delivery of immunizations. Traditionally, pneumococcal immunizations are given by health care providers along with the influenza immunization. It is possible that disruptions of influenza vaccine supply may have impacted the pneumococcal vaccination rates also. In October 2004, just as influenza immunization was beginning, one of the two influenza vaccine manufacturers producing inactivated influenza vaccine for the United States announced that, due to quality issues, none of its vaccine supply would be available. Loss of this anticipated vaccine drastically reduced the Nation’s influenza vaccine supply. CMS continues to address provider concerns about reimbursement rates, and in 2005, physicians also are paid for injections and vaccinations, even when performed on the same day as other Medicare-covered services, when previously this was not covered. In addition, the “Welcome to Medicare” effort, which began in 2005, addresses immunizations. Data Reliability Program Assessment and Evaluations Because of the current unpredictable nature of vaccine supply, there are no independent program evaluations planned at this time. Strategic Goal 4Enhance the Capacity and Productivity of the Nation’s Health Science Research Enterprise HHS recognizes the important role research plays in improving the Nation's health. As a result, many of the strategies that HHS has identified as important components in achieving its other strategic goals also incorporate a research base. This goal, therefore, focuses on creating the underlying knowledge and strategies that improve and maintain the research infrastructure that produces advances in health science. HHS is committed to advancing the understanding of the environmental factors that contribute to human disease. In order to accomplish this objective, HHS will continue to support basic, clinical, and applied biomedical and behavioral research with stringent peer review for scientific quality of research proposals. HHS will also develop and implement processes for setting research priorities that ensure that research is responsive to public health needs, scientific opportunities, and advances in technology. HHS places a high priority on improving the coordination, communication, and application of health research results. HHS commitment to enhancing the capacity and productivity of the Nation's health science research enterprise is demonstrated in many ways. This commitment is demonstrated by the continued development of the map of the human genome. Investment in this basic science research will provide important information for identifying patterns of genetic variation across all human chromosomes. Also the development of the Chemical Effects in Biological Systems shows the great strides and commitment present within HHS. Investment in this research will provide important information for identifying toxic substances in the environment, and help to treat people at the greatest risk of diseases caused by environmental pollutants or other toxicants. Highlighted Programs
4a International HapMap Project Program Description Understanding how genetic variations are inherited in DNA “blocks” or “haplotypes,” can achieve considerable savings in time, effort, and cost in uncovering the hereditary factors in disease. Sites in the genome where individuals differ in their DNA spelling by a single letter are called single nucleotide polymorphisms (SNPs). Recent work has shown that about 10 million SNPs are common in human populations. SNPs are not inherited independently; rather, sets of adjacent SNPs are inherited in blocks. The specific pattern of particular SNP spellings in a block is called a haplotype. Although a region of DNA may contain many SNPs, it takes only a few SNPs to identify or “tag” each of the haplotypes in the region uniquely. This presents the possibility of a major shortcut in identifying hereditary factors in disease. Instead of testing 10 million common SNPs, a rigorously chosen subset of about 400,000 SNPs could provide the essential information. Most common haplotypes occur in all human populations, although their frequencies may vary considerably. Initial studies also indicate that the boundaries between the blocks are remarkably similar among populations in Europe, Asia, and Africa. These data indicate that a human haplotype map (HapMap) built with samples from these three geographic areas would apply to most populations in the world, although additional testing of this conclusion is needed. NIH has taken a leadership role in the development of the HapMap, a catalog of the genotypes for the 270 samples for about 3.6 million SNPs, the haplotype blocks, and the SNPs that tag them. The HapMap is a tool that researchers can use to find the genes and variants that contribute to many diseases or disease risk. In addition, the HapMap is a powerful resource for studying the genetic factors contributing to variation in individual response to disease once it does occur, as well as to drugs and vaccines. As the numbers of identified SNPs increase, they are catalogued and made available to the research community in order to enhance the capacity and productivity of scientists studying the genetic basis of disease. Snapshot
Results and Performance The HapMap goal was initiated in 2002 with performance data available from 2003. To date, all annual targets have been successfully met and frequently exceeded as described below. The GPRA SRO-7.3 HapMap goal has been efficiently and effectively achieved on schedule. The genome-wide HapMap will be announced in late October, 2005. In 2005, the 2004 samples were used to complete the first pass draft of the HapMap, called the Phase I HapMap Eight centers genotyped a total of 1.007 million SNPs in all the samples. The patterns of human genetic variation were obtained from these data; thus, completing the goal. The methods to choose the tag SNPs that describe these patterns are available from the HapMap web site; these tag SNPs will be used in later studies of many diseases. In addition, genotyping has been attempted on an additional 4.7 million SNPs; the data have been produced and will be released in October on the HapMap web site. In 2004, the consortium had originally planned to identify an additional 3 million new SNPs to fill in areas where the current density of SNPs in public databases was not sufficient, but due to advances in technology the project was able to identify a total of 6 million new SNPs. The consortium collected samples and consent from 270 individuals from four populations (CEPH [U.S. residents with ancestry from Western and Northern Europe], Yoruba in Nigeria, Chinese, and Japanese). The consortium developed scientific strategies to choose which SNPs to study, to assess the quality of the data, and to derive haplotypes from the SNP data. In 2003, all of the living CEPH donors who provided the (previously existing) 90 U.S. samples used for the project specifically consented to their samples being used for developing the HapMap. Since some of the samples are from deceased individuals, they did not need to be reconsented. A total of six research groups performed genotyping for 132,000 SNPs during 2003. The SNPs were obtained from an international consortium of researchers that included targeted laboratories around the world. In order to ensure the SNP genotyping accuracy and completeness, samples were genotyped according to approved protocols. Further, the data are passed through a data analysis group that follows a universal algorithm to maintain accuracy and preciseness of the haplotypes. Impact of External Factors on Ability to Achieve Results: Accuracy of Data. The genotype data are 99.7 percent accurate, as measured by re-genotyping by three centers in the HapMap samples for each of 1000 SNPs that had already been genotyped for the HapMap. Quality and Completeness of SNP Databases. (Reich DE, Gabriel SB, Altshuler D. Nat Genet. 2003 Apr;33(4):457-8) showed that between 88 percent and 94 percent of the putative SNPs discovered are true SNPs. Since this publication, data analysis has continued and updated estimates now indicate that 95 percent of SNPs have been validated. All SNPs used to develop the HapMap were validated SNPs. http://www.nature.com/cgi-taf/DynaPage.taf?file=/ng/journal/v33/n4/full/ng1133.html. Intellectual Capital. The goals were met and exceeded, so potential shortages of intellectual capital did not limit the ability to achieve the goals. The HapMap Project developed methods to analyze the data that it is disseminating on the web, by publication, and by workshops, thereby enhancing the intellectual capital potential and reducing workforce burden and duplications. Program Assessments and Evaluations: HapMap was included in the FY 2006 PART of the Extramural Research program which was deemed Effective. The PART findings did not identify any recommendations specifically for HapMap. 4b Knowledge Base on Chemical Effects in Biological Systems (CEBS) Program Description Chemicals and mixtures in the environment and other air and water pollutants contribute to the burden of human disease. The problems of identifying environmental factors involved in the etiology of human disease and performing safety and risk assessments of drugs and chemicals have long been formidable issues. The prediction of potential human health risks involves consideration of (1) the diverse structure and properties of thousands of chemicals and other stressors in the environment, (2) the time and dose parameters that define the relationship between exposure and disease, and (3) the genetic diversity of organisms used as surrogates to determine adverse chemical effects. A new scientific field, toxicogenomics, has evolved to examine how chemical exposures disrupt biological processes at the molecular level. Toxicogenomics involves the collection, interpretation, and storage of information about gene and protein activity in order to identify toxic substances in the environment, and to help treat people at the greatest risk of diseases caused by environmental pollutants or toxicants. Because the pattern of regulation of various genes is different for different chemicals, scientists hope that these characteristic “signatures” will be useful in classifying exposure to these chemicals and other stressors by their biological activity. They also will provide a means of potentially predicting effects on human health from chemicals about which little is known. To enable this predictive capability, NIH is establishing a knowledge base on Chemical Effects in Biological Systems (CEBS). The system will contain data on global gene expression, protein expression, metabolite profiles, and associated chemical/stressor-induced effects in multiple species. Snapshot
Results and Performance Performance measures for this goal are outcomes. Annual targets are set to meet the program goal of developing a knowledge base on chemical effects in biological systems using a systems toxicology or toxicogenomics approach by 2012. As of June 2005, version 1.5 of CEBS has been available to the public on the CEBS website (http://cebs.niehs.nih.gov). This program provides simple query download capability of global molecular expression and toxicology/pathology data on a select number of studies of environmental chemicals and drugs. Version 2.0 of CEBS is now being developed. This version of CEBS will capture much more detail of individual studies (e.g., type of diet, room temperatures, light/dark cycle), as well as housing many more study results. Currently, staff is defining the content and functionality of each page needed for this more robust toxicogenomics database. Both of the previous annual targets for this goal were met. The 2003 target for this goal, to launch a pilot prototype database project to test the design and implementation of the database components and system architecture, was met as scheduled in 2003. The 2004 target for this goal�to create the capability to import, export, and link molecular expression data by extending the CEBS database object model to include toxicology/pathology fields and by creating a data portal that will load toxicology data�was met as scheduled in 2004. Sources that verify that the FY 2003 and FY 2004 performance targets were achieved include the CEBS website at http://cebs.niehs.nih.gov/. An account to access CEBS can be provided to permit independent verification of the launching of the database. In FY 2006, CEBS will be further developed to allow the capture and integration of transcriptomics, proteomics, and toxicologic data for the same compound. The FY 2007 performance measure is aimed at allowing the electronic sharing of �omics (suffix refers to the study of a system of biomolecules, e.g. proteomics, transcriptomics) and biology endpoint data. It will also allow the ability to explore/align relevant portions of disparate experimental datasets based on response. Data Reliability Data generated from microarrays, proteomics, toxicology, histopathology, and clinical chemistry will be managed in developing the CEBS. This data must be accurate in order to precisely define biological/toxicological pathways. Similarly, information about the biological effects of chemicals and other agents and their mechanism of action will be collected from the literature and stored. The NIH relies on international data capture guidelines (e.g., MIAME, minimal information about a microarray experiment) and counterpart databases, such as the European Bioinformatics Institute Tox-ArrayExpress, to enhance the number and quality of microarray and toxicogenomics data sets. Measurement data will come from:
Program Assessments and Evaluations CEBS was included in the FY 2007 PART of the Intramural Research program, the results of which will be released with the FY 2007 President’s Budget. Strategic Goal 5:Improve the Quality of Healthcare Services Improving the quality of life in the United States includes improving the quality of the health care services that people receive. This strategic goal is to improve health care services by reducing medical errors, improving consumer and patient information, and accelerating the development and use of electronic health information. To achieve this goal, HHS will continue the implementation of a variety of strategies designed to improve the delivery of health care services. These strategies include the development and dissemination of evidence-based practices, information systems, new technologies for the home and clinical setting, and improved reporting systems for medical errors and adverse events. Health quality improvement also means translating new knowledge of effective health services into strategies, educational tools, and information to help clinicians and health care policy makers improve health care quality. HHS will work to expand provider networks to disseminate health care quality information, enabling consumers to make informed choices. HHS will provide leadership to promote the development of a national health information infrastructure that takes advantage of the most current technology available. This will involve attention to the secure and confidential treatment of health information, adoption of national data standards, and research on the applications of a national health information infrastructure that informs consumers, patients, professionals, and other decision makers alike. HHS is committed to reducing medical errors and does so through programs such as the FDA’s Medical Product Surveillance Network System (MedSun). This program was found to be representative of the Department's advancements under this strategic goal. When fully implemented, MedSun will reduce device-related medical errors, improve patient safety by serving as an advance warning system for device problems, and a laboratory for research and two-way communication between FDA and each user-facility. Also assessed under this strategic goal are the prevention programs of the AHRQ. Highlighted Programs
5a Medical Product Surveillance Network (MedSun) Program Description The Food and Drug Administration's Modernization Act gives FDA the mandate to replace universal user facility reporting with the Medical Product Surveillance Network (MedSun) that is composed of a network of user facilities that constitute a representative profile of user reports. MedSun was created to reduce device-related medical errors; serve as an advanced warning system; and create a two-way communication channel between FDA and the user-facility community. MedSun program is designed to train hospital personnel to accurately identify and report injuries and deaths associated with medical products. Snapshot
Results and Performance FDA has achieved this goal for the last 3 years. In FY 2005, FDA achieved this goal again by expanding the MedSun system to a network of 354 facilities. Data Reliability FDA uses the services of a contractor to assist with administering the program. The contractor provides reporting assistance, processes reports submitted by participating hospitals, and subsequently releases the reports to FDA and the manufacturers. The contractor also supplies MedSun hospitals with feedback concerning the reports and FDA’s use of the data. The report data are held in a database behind FDA’s firewall. The contractor MedSun team sends a thank-you response to each reporter when a report is received and follows up with the reporters to ensure the data are complete and accurate. The contractor team may edit the report to ensure completeness and then the report is released to the FDA for action. Before a facility is given access to the MedSun system, representatives that will be using the system are required to undergo an orientation program. During the orientation program, MedSun users are required to sign security rules for the system which include password and user-id rules and a designation that the MedSun reports will fulfill the reporting requirements for the Safe Medical Devices Act of 1990. Representatives that generally sign the forms are the risk manager, the biomedical engineer, patient safety officer, or quality assurance people (typically there are two representatives from each site). After the users have attended the orientation, the representatives are given a user-id and password. If a facility decides to leave the MedSun program, that facility is removed from the tracking system and the representative(s) passwords are inactivated. These reporters access only a webserver that sits in the FDA service segment. If a site does not submit a report within 6- months, the contractor contacts the facility to follow-up. The contractor maintains a tracking database with detailed information on the user facilities such as size, number of reports submitted, and region. The contractor MedSun Team may enter the name, address, and other facility identifiers to the database, however only one person is tasked with maintaining the tracking database from which all administrative reports are generated. No duplicates can appear in the tracking database because it is programmed to reject duplicates. Program Assessments and Evaluations FDA was evaluated as an entire Agency during the FY 2005 PART assessment and achieved an overall rating of Moderately Effective. The PART findings did not identify any recommendations specifically for the MedSun Network. 5b Prevention Portfolio Program Description The work of the Prevention Portfolio supports improving the quality of healthcare by increasing the appropriate use of effective healthcare services by medical providers and by increasing consumer use of evidence-based preventive services information. Developing and sustaining public and private partnerships are important steps for the Prevention Portfolio to effectively target and reach multiple audiences to improve the delivery of clinical preventive services. The Prevention Portfolio develops strategic partnerships based on the role of partners in delivering clinical preventive services and their impact on healthcare systems. Partners include federal agencies, health professional organizations, healthcare delivery organizations, consumer organizations, and employer organizations. Snapshot
Results and Performance In FY 2005, Prevention achieved its target of establishing baselines for measuring preventive services that are delivered in the clinical setting. The baseline measures have both a quantitative and a qualitative component. The quantitative measure, which assesses the degree to which clinical preventive services are being delivered, is based on data from the 2004 National Healthcare Quality Report (NHQR). Qualitative data regarding the performance measure were obtained through meetings and focus groups with selected target audiences that have been determined to be critical to the successful dissemination, implementation and integration of the United States Preventive Services Task Force (USPSTF) recommendations. AHRQ also met its FY 2005 target of establishing a baseline of partnerships within the Prevention Portfolio with a wide variety of Federal agencies and non-federal organizations, foundations, and health systems to improve the dissemination, implementation and integration of evidence-based preventive services. These partnerships provide avenues to reach specific audiences including primary care providers, consumers, employers, researchers and policy-makers. The portfolio continues to work through these partnerships to improve the quality of clinical preventive services by increasing the appropriate use of effective health care services by healthcare providers and by increasing consumer use of evidence-based health care information Data Reliability Quantitative data from national reports of established reliability and validity were utilized in 2005 to establish baselines for the delivery of clinical preventive services in the general population. The National Health Quality Report (NHQR), produced by AHRQ, is composed of data from multiple databases (including the Medical Expenditure Survey Panel [MEPS], the Healthcare Cost and Utilization Project [HCUP], and the Consumer Assessment of Health Plans [CAHPS]). Sources of qualitative data that were used to complement the quantitative service delivery data included two stakeholder meetings, an expert panel, and four focus groups of clinicians. Qualitative data were gathered by AHRQ staff, research contractors, and organizational partners. Qualitative data for partnerships were gathered primarily by outside contractors. The information obtained was analyzed, synthesized and reported using established methodology. Because of the limitations of qualitative data with respect to validity, the results obtained from these sources were used to identify successful case studies, themes, and areas for future opportunity. Program Assessments and Evaluations The program was not subject to an independent evaluation or a PART assessment during FY 2005. Strategic Goal 6:Improve the Economic and Social Well-being of Individuals, Families, and Communities, Especially Those Most in Need HHS promotes and supports interventions that help disadvantaged and distressed individuals, families, and communities improve their economic and social well-being. To achieve this strategic goal, HHS supports targeted efforts to increase the independence and stability of low-income families, people with disabilities, older Americans, American Indian/Alaska Native, victims of domestic violence, refugees, and distressed communities. HHS will continue to support community and faith based organizations that provide services to individuals and communities in need. ACF’s Office of Family Assistance and AoA’s Aging Services program illustrate HHS’ commitment to self-sufficiency. ACF’s Temporary Assistance for Needy Families program promotes work and self-sufficiency to improve the economic well-being of individuals and families through various state- and Tribal-administered programs. The Aging Services program ensures that local services are provided to seniors who are at risk of losing their independence. The representative performance measures discussed in this section relate to AoA programs targeting caregivers and severely disabled older clients and ACF’s TANF program, whose recipients have become newly employed and remain employed. Highlighted Programs
6a Temporary Assistance for Needy Families (TANF)Administration for Children and Families (ACF), Office of Family Assistance (OFA) Program Description In accordance with HHS Strategic Objective 6.1, “Increase the proportion of low-income individuals and families, including those receiving welfare, who improve their economic condition,” the purpose of the TANF program is to reduce dependency by promoting job readiness, employment, and marriage. It is also designed to prevent out-of-wedlock pregnancies and to encourage the formation and maintenance of two-parent families. The TANF program, which is administered by the states and Tribes, provides a range of benefits/services in support of moving recipients from welfare to work and self-sufficiency. These include cash assistance to meet basic needs (food, clothing, shelter, etc.), employment training, work expenses, transportation, and child care. Title IV-A of the Social Security Act, as amended by the Personal Responsibility and Work Opportunity Reconciliation Act of 1996, requires that states and territories administer programs; tribes have the option to administer their own programs. States and territories each receive a block grant allocation with a requirement for states to maintain a historical level of state spending (for welfare and other services for low-income families) known as Maintenance of Effort. The block grant allocation for tribes is withdrawn from the respective state allocation in which the tribes are located. The Maintenance of Effort requirement does not apply to tribes. The block grant covers benefits, administrative expenses, and services. States, territories, and tribes determine eligibility and benefit levels as well as services provided to needy families. The TANF program replaced the former Aid to Families with Dependent Children, Job Opportunities and Basic Skills Training, and Emergency Assistance programs, and changed the Nation's welfare system into one that requires employment while time-limiting assistance. Snapshot
Results and Performance The TANF Job Retention Rate is one of several work-related measures. It measures the unduplicated number of employed adult recipients in each quarter of the performance year who were also employed in the first and second subsequent quarters. (At some point, the adult might have become a former recipient). In FY 2003, the job retention rate was 59 percent, missing the 68 percent target. The FY 2004 performance results will be available in October 2005; however, we do not expect significant change from the FY 2003 rate. When setting the 68 percent target, we did not take into consideration the dampening effect of the caseload reduction credit, which reduced recipient work participation rates. Also, the current employment retention measure represents a more rigorous measure than the one used prior to FY 2000, because it measures job retention for a longer period of time. Whereas the previous measure assessed job retention for one subsequent quarter, the current measure looks at retention for two subsequent quarters. The program has recently revised outyear targets to reflect the effects of the caseload reduction credit, as well as the changes in the definition of the performance measure. However, the targets will be updated again with passage of the pending TANF reauthorization legislation, which will strengthen the current work requirements to ensure adult TANF recipients are engaged in work or activities leading to employment. Data Reliability The TANF job entry, job retention and earnings gain employment data is derived from matching TANF adult recipient social security numbers against the National Directory of New Hires (NDNH) wage data base. All employers are required to report quarterly wage information to the State Employment Agencies who in tern are required to reports this information to the NDNH. The NDNH wage data base is the most complete national set of wage information available and includes federal employment wages. The only wages not included are self employment wages and some farm employment. Program Assessments and Evaluations The TANF program participated in the 2005 PART assessment in preparation for the FY 2007 budget. The results will be published in February 2006 with the FY 2007 President’s Budget. 6b Aging Services Program Program Description The Aging Services program includes all the program activities of the AoA. Through its grants to states, Tribal organizations, and other community service providers, AoA funds a network of aging service providers. These providers make essential home and community-based services available across the country to elderly people and family caregivers to help keep America's rapidly growing older population healthy, secure and independent in the community. Services provided to elders include but are not limited to: meals, transportation, caregiver support, personal care, information and assistance, nursing-home ombudsman, elder rights protection, and health promotion. Snapshot
*Those with 3 or more ADL limitations, and therefore nursing home- eligible
Results and Performance AoA reports on a total of 16 performance measures in its performance budget that directly support HHS' strategic goals, including improving the economic and social well being of individuals, families and communities, especially those most in need (goal 6). These measures support three broad performance measures, which form an integral check and balance for one another. They are: 1) improving efficiency; 2) improving client outcomes, and 3) improving targeting to vulnerable elder populations. In prior reports, AoA used the performance measure: A significant percentage of Older Americans Act, Title III service recipients live in rural areas. This measure is no longer included in this report because it was eliminated from the FY 2005 GPRA plan. AoA underwent a PART assessment during the FY 2005 budget formulation process and numerous new performance measures were developed collaboratively with the Office of Management and Budget. Measures included in the PART assessment are required to be incorporated into agency GPRA plans. At the same time, agencies were being encouraged to decrease the total number of measures included in their plans. As a result, all non-PART Title III measures were eliminated from AoA’s FY 2005 plan including the rural targeting measure. Since the PAR requires agencies to report on performance measures included in their GPRA plans, AoA is reporting below on two measures that were included in the FY 2005 GPRA plan. For the purposes of this Performance and Accountability Report, AoA features two of the fundamental measures of the performance of the aging network in helping elderly individuals maintain their independence in the community:
The specific performance for each measure will be addressed below. Targeting: Increase the number of severely disabled clients who receive selected home and community-based service. In FY 2003 approximately 280,000 severely disabled older individuals received home-delivered meals, roughly 30 percent of all older individuals who received such services. (AoA defines severely disabled older persons as those with three or more ADL limitations who are therefore nursing-home eligible.) In FY 2004, AoA improved performance, serving home delivered meals to 293,500 severely disabled elders. It is a positive indicator that the network achieved a 4 percent increase in this critical performance measure in one year. AoA’s performance target for 2005 is ambitiously set at 302,000, which is an 8 percent increase. AoA expects to demonstrate achievement of this target when the data become available in February, 2006. Client Outcomes: Increase the percentage of caregivers reporting that services have definitely helped them provide care longer for older individuals. Client outcomes are obtained by asking the older individuals and caregivers who receive the services to evaluate AoA-provided services in terms of quality, usefulness, and effectiveness. In addition, caregivers assess the extent to which services help keep older individuals at home and in the community. In FY 2003, 48 percent of caregivers reported that services definitely helped them provide care longer. In 2004, performance improved to 52 percent. Our performance target for 2005 is to have 62 percent of caregivers report that AoA services definitely helped them provide care for older individuals for a longer period of time. AoA expects to demonstrate achievement of this ambitious target when the data become available in February, 2006. The client outcome measure highlighted here is particularly strategic. Caregivers report that AoA services enable them to care for older family members for longer periods of time than would otherwise be possible without AoA services. This is critical, since most of the assistance provided to frail older persons is provided by informal caregivers. Support for informal caregivers is, therefore, an important and highly leveraged form of assistance and it is critical to program success. The assessment by caregivers of the value of the help they receive is therefore a significant measure of the achievements of the AoA program. Data Reliability Through the National Survey of Recipients of Older Americans Act Services, AoA focuses on the assessment of quality through consumer surveys. A highly experienced survey research firm is the contractor that conducted AoA’s national surveys of service recipients and they employ numerous validation procedures to assure data quality. Survey data quality is good; survey response rate are consistently above 80 percent and the data are consistent with similar data collections conducted by state grantees. State Units on Aging are required to collect, compile, and annually transmit to AoA program information and data known as the State Program Report. Descriptive material on this report and its results are on AoA’s website at http://www.aoa.gov/prof/agingnet/NAPIS/napis.asp. Program Assessments and Evaluations During the FY 2005 budget formulation and process a PART review covering the Aging Services Program was conducted and the program was rated Moderately Effective. As a result of the previous PART review, AoA initiated a number of program evaluations which are currently in process. Almost 90 percent of Older Americans Act funded services are in the process of being evaluated. These evaluations are assessing Title IIID health promotion and disease prevention; Title IIIB supportive services such as transportation, home care and other home and community-based services; Title IIIC nutrition programs; and Title VI Native American programs. AoA uses program performance results in budget requests, budget narratives, and program reviews. The three AoA GPRA measures of program efficiency, effective targeting to vulnerable elders and client outcomes were developed during the latest PART assessment and are used to inform AoA staffing decisions, the development of discretionary grant initiatives and contracts. As an example, data shows that AoA programs are effectively targeting the most frail and vulnerable elderly populations. These individuals often are also on Medicaid. The Aging and Disability Resources program, a program that seeks to streamline eligibility and increase access to home and community-based services, was expanded over the last several years. This program is a partnership between AoA and CMS and was almost doubled in size in 2005; the program grew from 24 state grantees to 43 this year. Upcoming program evaluations will provide even greater opportunity for program enhancements as AoA strives to drive change in the long-term care system in order to help older adults age at place, at home, and in the community. Strategic Goal 7:Improve the Stability and Healthy Development of Our Nation’s Children and Youth In order to promote the development and stability of the Nation's children and youth, HHS will continue moving forward with several important efforts. HHS will continue to support the social and cognitive development of preschool children; provide supports for family formation and healthy marriages; support programs that increase the involvement and financial support of non-custodial parents; and increase the percentage of children and youth living in a safe and stable environment. The Child Welfare programs will continue to support states and localities in their efforts to keep children safe. Services offered include preventive intervention, where appropriate, so that children can remain in their homes, identifying alternative placements like foster care when necessary, and reunification services so that a child can return home. HHS will also support research and demonstrations that will focus on the prevention and treatment of child abuse, neglect, and family violence. This section highlights ACF Child Support Enforcement, Child Welfare, and Head Start programs. Their representative performance measures illustrate the Department's continuing commitment to improving the stability and promoting the development of our Nation's children and youth. The Child Support Enforcement program assures that support is available to children by locating parents and by establishing paternity and support obligations. These efforts will continue to be an integral part of the Department's effort to increase parental responsibility by promoting the involvement of non-custodial parents in the lives of their children. Head Start programs ensure that children are ready to succeed at school by supporting their social and cognitive development. These programs also provide comprehensive child development services, including educational, health, nutritional, social, and other services, to primarily low-income families. They also engage parents in their child's preschool experience by helping them achieve their own educational and literacy goals as well as employment goals, supporting parents' role in their children's learning, and emphasizing the direct involvement of parents in the administration of local Head Start programs. Highlighted Programs
7a Child Support Enforcement (CSE) Program Description: In accordance with HHS Strategic Goal 7.3, “Increase the involvement of financial support of non-custodial parents in the lives of their children,” HHS is taking steps to improve the stability and healthy development of the Nation's children and youth. Child Support Enforcement (CSE) demonstrates this commitment to the Nation's children and youth in several ways. The CSE program ensures that support is available to children by locating parents, establishing paternity, and enforcing support obligations. It is an integral part of the Department's effort to increase parental responsibility by promoting fathers' involvement in the lives of their children. CSE works in collaboration with state agencies to foster family responsibility and promote self-sufficiency by ensuring that both parents support children financially and emotionally. The CSE program is administered by state and local governments, and is funded in part by the Federal Government, which reimburses states for 66 percent of administrative costs and 90 percent of paternity laboratory costs. The Federal role is to provide direction, guidance, technical assistance, oversight, and some critical services to states' CSE programs for activities mandated under Title IV-D of the Social Security Act. Snapshot
Results and Performance The Title IV-D collection rate for current support is computed by taking collections on current support in IV-D cases divided by current support amount owed in IV-D cases. Data for these measures can be found in: http://www.acf.hhs.gov/programs/cse/pubs/2004/reports/preliminary_data/table_9.html (Table 9) http://www.acf.hhs.gov/programs/cse/pubs/2004/reports/preliminary_data/table_10.html (Table 10) These tables are a part of the larger CSE FY 2003 Preliminary Data Report, issued on June 14, 2004 (DCL-04-23). As demonstrated in Table 9 (see link above), the total amount of current support due in FY 2003 was $27.1 billion, an approximate increase of 3 percent over FY 2002. Table 10 reports that the total amount of child support distributed as current support in FY 2003 was $15.7 billion, approximately a 4 percent increase over FY 2002. Combined, this data represents a collection rate which meets the FY 2003 target of 58 percent for current IV-D support. This means that 58 percent of the child support owed in that year was collected and distributed to families. The 2005 data will not be available until September 2006 because of the time that data reliability audits take. Data Reliability CSE is largely dependent on state administrative systems for collecting performance data. In terms of data quality and reliability, states maintain information on the necessary data elements for CSE program measures. Most states use an automated system to maintain data, while a few maintain the data manually. All states were required to have a comprehensive, statewide automated CSE system in place by October 1, 1997. In FY 2004, 52 states and territories were Family Support Act certified; 51 states and territories have been Personal Responsibility and Work Opportunity Reconciliation Act of 1996 certified as of May 2005. Continuing implementation of these systems, in conjunction with the cleanup of case data, will improve the accuracy and consistency of reporting. Data reliability audits are conducted annually. Federal auditors evaluate whether or not state data used to calculate the performance measures are complete and reliable. Items from the OCSE-157 report are evaluated for this measure; the performance measure is calculated using two lines from this report. If any line item used in the calculation does not meet the data reliability standard, the entire performance measure is considered unreliable. Program Assessments and Evaluations Two Office of Inspector General (OIG) reports issued are the following: “Eight-State Review of the Ability of Noncustodial Parents to Contribute Toward the Medical Costs of Title IV-D Children That Were Paid Under the Medicaid Program,” issued June 7, 2005. The OIG recommendations for ACF and the Centers for Medicare and Medicaid Services (CMS) are:
In response to the first recommendation, OCSE is currently considering a number of medical support issues. Regional meetings are planned for FY 2005 during which OCSE and CMS will be discuss the collection of Medicaid costs from non-custodial parents who have the ability to pay. OCSE will also share OIG findings with states through a “Dear Colleague” letter. For the last two recommendations, CSE will collaborate with CMS in its efforts to draft legislation and inform states of their options to use the Title IV-D agency to recover costs from noncustodial parents. “Eight-State Review of the Ability of Noncustodial Parents to Contribute Toward the Medical Costs of Title IV-D Children That Were Paid Under the State Children’s Health Insurance Program,” issued May 16, 2005. OIG recommends that CMS (1) determine whether additional Federal funds are needed to assist states in interfacing their Title IV-D and State Children’s Health Insurance Program (SCHIP) databases and in implementing a process to collect SCHIP costs from noncustodial parents, and (2) provide such funds as appropriate. With respect to OIG’s first recommendation CMS agreed to alert States through the CMS SCHIP Technical Advisory Group and regional offices of their option to pursue the Federal and State shares of SCHIP costs. Regarding the second recommendation CMS commented that States have the ability, under their 10-percent administrative SCHIP cap, to fund the administrative costs of building an infrastructure with the State IV-D agency. GAO conducted an entrance conference on the subject of CSE administrative costs. The objectives are: 1) identify and compare state administrative costs and determine how they have changed over the years, 2) assess whether the funding structure has influenced administrative costs, 3) identify steps states have taken to reduce or minimize the increase in administrative costs, and 4) identify steps HHS has taken to help reduce administrative costs while continuing to provide adequate funding for the collection of child support. 7b Child Welfare Program Description In accordance with HHS Strategic Goal 7 to “Improve the stability and healthy development of our Nation's children and youth” and HHS Strategic Objective 7.4 to “Increase the percentage of children and youth living in a permanent, safe environment,” the purpose of the ACF Child Welfare programs is to prevent maltreatment of children, provide in-home services for at-risk children and families, find temporary placements for children who must be removed from their homes, and achieve safe and stable permanent outcomes for children removed from their homes. Foster Care provides stable environments for those children who cannot remain safely in their homes and ensures children’s safety and well-being while their parents attempt to resolve the difficulties that led to the out-of-home placement. When the family cannot be reunified, it provides a stable environment until the child can be placed permanently with an adoptive family or in a guardianship arrangement. Adoption Assistance funds are available for a one-time payment for the costs of adopting a child as well as for monthly subsidies to adoptive families for care of the child. In December 2003, President Bush signed the Adoption Promotion Act of 2003, which reauthorized the adoption incentive payments program first created by the Adoption and Safe Families Act of 1997. Snapshot
Results and Performance 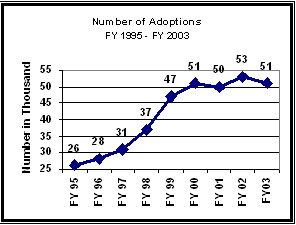
As the graph to the right indicates, the total annual number of adoptions of children with involvement in the public child welfare system has increased dramatically since FY 1995. There were 53,000 adoptions in FY 2002, almost double the number of adoptions in FY 1995 (26,000) and, on average, 6,000 more adoptions than in FY 1999. Preliminary data indicate that there were 50,000 adoptions in FY 2003, although this number may increase as additional adoptions for that year are reported. Since FY 2000, the annual number of adoptions has flattened and ACF did not meet its targets for FY 2002 and FY 2003.3 This can largely be explained by three factors. First, a measure of the absolute number of adoptions does not take into account the number of children in foster care who are “available” for adoption. There was an unanticipated decline in the total number of children in foster care from 567,000 in FY 1999 to 523,000 in FY 2003. The adoption rate 4�the ratio of the number of adoptions to the number of children in foster care at the end of the prior year�takes the declining foster care population into account. The adoption rate increased from 8.4 percent in FY 1999 to 9.4 percent in FY 2003. Second, established targets did not take into account that the average age of the children waiting for adoption would increase, making it more challenging to find adoptive homes for the children. Third, significant proportions of the adoptions in recent years were of children who had been in the system for a long time and who represented a backlog of cases.5 The goal of 58,500 adoptions in FY 2003 was not met for a variety of complex reasons, including the decline in the number of children in foster care; the increase in age of the children entering care and waiting to be adopted; the increase in the percentage of children with a case plan goal of reunification; and the decline in the percentage of children with a case plan goal of adoption. To meet their adoption goals, the Children's Bureau is implementing a major effort to recruit adoptive families called "AdoptusKids." In addition, the Children's Bureau will continue to use the Child and Families Services Reviews (CFSR) to work with states to improve their child welfare systems. Data Reliability As required by regulation, state child welfare agencies electronically report semi-annual foster care and adoption data twice a year to the Adoption and Foster Care Analysis and Reporting System (AFCARS), operated by the ACF. Information about the AFCARS federal data collection system is available at: http://www.acf.hhs.gov/programs/cb/dis/afcars/index.htm. When processing each AFCARS submission, ACF uses more than 700 edit-checks to identify data quality errors. In response to each submission, ACF sends the state an automatically generated report of the data quality results. Based on either this data quality report or additional data quality reviews by ACF analysts, many states resend more accurate and improved subsequent submissions to the AFCARS. This iterative data quality control process ensures the reliability of the states’ data used for this measure. Program Assessments and Evaluations PART assessments for two Child Welfare programs (Child Abuse Prevention and Treatment Act State Grants and Community Based Child Abuse Prevention) were released in February 2005. Both programs were found to have a clear purpose, address a specific and existing need, and be free of major program design flaws that would limit effectiveness or efficiency. PART assessments are currently being conducted on three Child Welfare programs (Adoption Incentives, Adoption Assistance, and Adoption Opportunities). These assessments will be published in February 2006. 7c Head Start Program Description In accordance with HHS Strategic Goal 7.2, “Improve the development and learning readiness of preschool children,” Head Start is intended for low-income preschool children and their families, the basic philosophy guiding the Head Start program is that children benefit from high quality early childhood experiences. Head Start emerged from a body of research that indicated that the provision of services to low-income children and families prior to the formal school years could ameliorate some of the negative consequences of poverty, such as poor school performance and low self-esteem. Head Start promotes school readiness by enhancing the social and cognitive development of children through the provision of educational, health, nutritional, social, and other services. Programs emphasize cognitive, language, and socio-emotional development to enable each child to develop and function at his or her highest potential. Head Start engages parents in their children's learning and helps parents to make progress toward their educational, literacy, and employment goals. Head Start continues to emphasize its role as a national laboratory to test and refine educational approaches, and to use child outcomes to help guide program development. Recognition of emerging research, changing needs, and developing trends enables the Head Start Bureau to make resources available for targeted programmatic improvements. Head Start conducts research, demonstration, and evaluation activities to test innovative program models and to assess program effectiveness. In FY 1994, the Early Head Start program was established in recognition of mounting evidence that the earliest years, from birth to 3 years of age, matter a great deal to children's growth and development. Snapshot
Results and Performance Head Start came within 1 percentage point of meeting the ambitious target of 80 percent of children completing Head Start being rated by their parents as in excellent or very good health. This is a significant achievement given the children are a disadvantaged population with limited access to health care. A likely contributor to this shortfall is the persistent difficulty low-income families face in gaining timely access to needed health care, with particular problems in receiving oral health care. To address this need, the Head Start Bureau has implemented, in partnership with the Maternal and Child Health Bureau/Health Resources and Services Administration/Department of Health and Human Services, an Oral Health Initiative which since 2004 has supported a national network of technical assistance designed to improve Head Start children's access to oral health care. With this resource focused on improved oral health care access, and its continued attention to the overall health of Head Start children, Head Start expects to reach the 80 percent target. Data Reliability The Family and Child Experiences Survey (FACES) was launched as a part of the Head Start Program Performance Measures Initiative. The goal of this initiative, and of FACES, was to provide solid representative data on the characteristics, experiences, and outcomes for children and families served by Head Start. The FACES study uses scientifically established methods to collect data that can be used to analyze Head Start's quality. All the measures used in FACES to measure child outcomes and program quality (including the Peabody Picture Vocabulary Test - PPVT, the Woodcock-Johnson Applied Problems scale, and the Early Childhood Environment Rating Scale -ECERS) have been assessed for validity and reliability, and are well-respected in the field of child development. The use of new cohorts every 3 years allows the program to have continual access to up-to-date information about program performance and quality. Because the data are collected every 3 years, there is a lag in the data reporting. Program Assessments and Evaluations The Congressionally-mandated Head Start Impact Study is being conducted across 84 nationally representative grantee/delegate agencies. Approximately 5,000 newly entering 3- and 4-year old children applying for Head Start were randomly assigned to either a Head Start group that had access to Head Start program services or to a non-Head Start group that could enroll in available community non-Head Start services, selected by their parents. Data collection began in fall 2002 and is scheduled to continue through 2006, following children through the spring of their 1st-grade year. The study quantifies the impact of Head Start separately for 3- and 4-year old children across child cognitive, social-emotional, and health domains as well as on parenting practices. For children in the3year-old group, results from the first year of data collection demonstrate small to moderate positive effects favoring the children enrolled in Head Start for some outcomes in each domain. Fewer positive impacts were found for children in the 4-year-old group. An April 2005 GAO report, “Comprehensive Approach to Identifying and Addressing Risks Could Help Prevent Grantee Financial Management Weaknesses,” found that ACF has not developed a comprehensive risk assessment system to identify financial management weaknesses of Head Start grantees. Though ACF has many processes it uses to collect information on how well grantees are performing and managing their federal grant funds (including the Program Information Report and the Program Review Instrument for Systems Monitoring), GAO suggested that there was no systematic process for bringing together information gained from the different data collection processes. GAO recommended that ACF develop a comprehensive risk assessment to identify weaknesses that could limit the program’s ability to achieve its objectives. In response, ACF has pledged to take the necessary steps to develop and implement an annual comprehensive risk assessment that draws information from a variety of data sources. ACF will also continue to focus on ensuring that Head Start grantees are serving all of the children for which the grantees have been funded and will take appropriate steps in those situations where grantees are found to be underenrolled. A May 2005 GAO report, “Further Development Could Allow Results of New Test To Be Used for Decision Making,” GAO suggested that results from the first year of the National Reporting System (NRS) are of limited value for accountability purposes because the Head Start Bureau has not shown that the NRS meets professional standards for such uses. GAO also suggested that the NRS also may not provide sufficient information to target technical assistance to the Head Start centers and classrooms that need it most. GAO recommends that ACF determine how NRS data will be used for accountability and targeting technical assistance; monitor the effects of the NRS on local Head Start practices; use first year NRS results to conduct further study of the reliability and validity of the NRS; compile a detailed, well-organized document on the technical quality of the NRS; improve management of its data on NRS participation; and study the costs and benefits of sampling in administering the NRS. ACF is taking steps to improve the management and accuracy of data on the number of children eligible for and participating in the NRS and is taking a number of steps to establish the reliability and validity of the NRS instrument and assessment data. Strategic Goal 8:Achieve Excellence in Management Practices HHS is committed to improving the efficiency and effectiveness of the Department's programs by creating an organization that has a citizen-based focus, is results-oriented, and is market-driven, where practicable. The President's Management Agenda identifies key elements needed for HHS to achieve its commitment to establishing more effective Department management. In particular, HHS is dedicated to improving management of our financial resources; using competition to obtain the best price for services acquired; improving the management of human capital and tying human capital goals to program performance goals; using technology wisely and in a cost-effective manner; and achieving an integrated performance budget. There are many steps currently under way to continue the management practices improvement. HHS will continue to plan for the future, by recruiting appropriately skilled employees through the Emerging Leaders program. HHS will also use PART assessments to inform budget decisions, program improvements, legislative proposals, and management actions (to date roughly 60 percent of HHS programs have been assessed in the PART process). Also illustrative of HHS commitment to achieve excellence in management practices are CMS’ Medicare Integrity program and the Office of Inspector General’s Healthcare Fraud and Abuse Control programs. The Medicare Integrity program ensures the right Medicare amounts are paid to a legitimate provider for an eligible beneficiary. Similarly, the Healthcare Fraud and Abuse Control program conducts and supervises audits, inspections, and investigations of HHS programs, and provides guidance to the health care industry. Highlighted Programs
8a Medicare Integrity Program (MIP) Program Description CMS’s program integrity efforts ensure the Medicare program pays the right amount to a legitimate provider for covered, reasonable and necessary services that are provided to an eligible beneficiary. CMS’s program integrity activities are primarily funded through the Medicare Integrity Program (MIP), established by the Health Insurance Portability and Accountability Act of 1996. The MIP includes medical review and benefit integrity activities, provider education and training, Medicare Secondary Payer, and provider audits. CMS’s overall program integrity efforts are supplemented by funding from CMS’s program management account and other funds made available from the Health Care Fraud and Abuse Control Account. Snapshot
[1] Per Improper Payments Information Act (IPIA) requirements, HHS began reporting on gross (under- and over- payments) results (as shown in the table above) in FY 2004. The FY 2004 net result was 9.3%. Results and Performance The purpose of this goal is to continue to reduce the percentage of improper payments made under the fee-for-service program as reported in the CMS Financial Report. One of CMS's key goals is to pay claims properly the first time. This means paying the right amount, to legitimate providers, for covered, reasonable and necessary services provided to eligible beneficiaries. Paying right the first time saves resources required to recover improper payments and ensures the proper expenditure of valuable Medicare trust fund dollars. The complexity of Medicare payment systems and policies, as well as the high numbers of contractors, providers, and insurers involved in the Medicare fee-for-service program create vulnerabilities. CMS has implemented an Error Rate Reduction Plan designed to minimize these vulnerabilities and reduce the Medicare claims payment error rate. The FY 2005 paid claims error rate of 5.2% exceeded CMS' Medicare Fee for Service Error Rate GPRA goal of 7.9%. Because of this dramatic improvement, CMS has chosen to revise its GPRA goals for 2006 and beyond. The Comprehensive Error Rate Testing (CERT) program was initiated in FY 2003 and has produced a national error rate for each year since its inception. The OIG produced error rate information for years before those included in the FY 2003 report. In 2004, CMS began reporting gross error rates in addition to the net error rates previously reported. A gross improper payment amount is calculated by adding underpayments to overpayments. A net improper payment amount is calculated by subtracting underpayments from overpayments. This change was necessary in order to comply with new Improper Payments Information Act requirements. As a transition, the FY 2004 reports will contain both net and gross numbers. Future reports will contain only gross numbers. In addition to the national error rate, CERT findings include contractor-specific error rates, as well as two additional rates used to help measure provider compliance with Medicare payment and billing requirements, and the accuracy of the contractor’s claims payments and processing activities. These rates known respectively as the provider compliance error rate and the services processed error rate, allow CMS to quickly identify emerging trends in managing Medicare contractor performance. Data Reliability The data for this program are complete and reliable. CMS and the CERT contractors audit the data through ongoing quality control measures that include comparison of the number of claims in the CERT universe (i.e., all claims Medicare contractors receive) to an independent CMS report of the number of claims Medicare contractors received and verify that paid amounts for sampled claims match independent CMS records of claims payments. The data are audited through the CMS Chief Financial Officer Report. Program Assessment and Evaluations An independent auditing firm, overseen by the OIG, regularly evaluates the CERT program. Each year an independent auditing firm reviews the national estimates and the sampling procedures used for the CERT estimate. In addition, the Office of Inspector General assesses the CERT program through on site audits and consultative review of new CERT plans and procedures. 8b Office of Inspector General (OIG) Program Description The primary function of the OIG is to detect and prevent fraud and abuse and to recommend policies designed to promote economy, efficiency, and effectiveness in the administration of HHS and its programs. OIG accomplishes its purpose by conducting and supervising audits, inspections, and investigations of HHS programs, and providing guidance to the healthcare industry. Approximately 76 percent of FY 2005 OIG resources were devoted to the Healthcare Fraud and Abuse Control Program, a mandatory program established by the Health Insurance Portability and Accountability Act of 1996. It is a joint program of HHS and the Department of Justice (DOJ), and its purpose is to coordinate Federal, state, and local law enforcement activities with respect to healthcare fraud and abuse, including conducting investigations, audits, evaluations, and inspections relating to the delivery of and payment for healthcare in the U.S. Five percent of FY 2005 resources were dedicated to mandatory work emanating from the Medicare Modernization Act of 2003. The remaining approximately 19 percent of OIG resources were allocated to audits, investigations, and inspections of other HHS programs, including its public health and human services programs, and general departmental oversight. Snapshot
Results and Performance Return on investment has long been the primary measure of the effectiveness and efficiency of the OIG. The ratio is calculated by dividing the documented savings for the fiscal year by the OIG budget for that year. Fiscal year savings is calculated by summing expected recoveries from investigations that were successfully prosecuted by the DOJ, settlements that occur in lieu of criminal prosecution, monetary penalties, audit disallowances, and savings from funds not expended as a result of legislative and administrative actions stimulated by recommendations in OIG audits and inspection reports. For FY 2005, the ratio of documented savings per budget dollar invested was $168:1. This surpassed FY 2004 Return on Investment (ROI) by 12 percent, but was 5 percent less than the target. Since the results of OIG work are not realized in the year in which resources are expended, often requiring five or more years to be realized, an increase in resources in any given year does not translate into results during that year. This occurred in FY 2005 when nearly $11 million was added to the OIG budget for the purpose of carrying out mandates contained in the MMA. If the MMA supplement is excluded from the ROI calculation, OIG FY 2005 ROI would have been $177:1, which exceeds the $176:1 target. With or without the MMA supplement, the result continued the OIG record of returns that far exceed its cost of operation. Data Reliability The source data used for these results are the following: expected recoveries from investigations are entered into the OIG investigations data system “IRIS.” Documents that officially report the conclusion of criminal and civil proceedings, including the amount of fines, penalties, and restitution must be received by the OIG before the expected recoveries are allowed into the IRIS system. Audit disallowances are entered into the OIG WEB AIMS system by the Audit Resolution staff of the HHS Office of the Assistant Secretary for Budget Technology and Finance, and are reconciled to the OIG audit disallowance issuances. Savings from legislative and administrative changes are those scored and published by the Congressional Budget Office as part of the legislative process. All of the above are subject to periodic audit by the Government Accountability Office (GAO). Program assessment Rating Tool The following table displays information on the 62 HHS programs assessed using the PART during the FY 2004 - FY 2006 budget formulation process. The table displays the program, the year the assessment took place, the narrative rating, the key findings and actions, and the strategic goal that the PARTed program supports.
--------------------------------
2 Revised from 49,000 as reported in FY 2006 Congressional Justification. 3 While noting that adoptions finalized in one year may be reported in later years, the current FY 2003 number of adoptions is 50,000. It is likely, with new AFCARS adoptions submissions and resubmissions from the states, that the number of adoptions finalized in FY 2003 will increase by as much as 2,000 adoptions. 4 Defined as the number of adoptions divided by the number of children in care on the last day of the prior fiscal year multiplied by 100. 5 With improved case-practice under the reforms implemented by the Adoption and Safe Families Act (ASFA), large backlogs of adoption cases needing to be finalized should be eliminated. 6 In FY 2002, 881,869 children were up-to-date on a schedule of age-appropriate preventive and primary health care. 186,572 children received medical treatment as a result of a diagnosed health condition. 7 Because FACES has triennial cohorts, data for a comparable sample of 4-year-olds in Head Start is only available every 3 years. Data from the 2000-2001 Head Start program year for the 2000 FACES cohort is reported in 2001, 2002, and 2003 for all FACES measures. Similarly, data for the 2003 FACES cohort from the 2003-2004 program year will be reported in 2004, 2005, and 2006. |
|||||||||||||||||||||||||||||||||||||||||||||||||||||||||||||||||||||||||||||||||||||||||||||||||||||||||||||||||||||||||||||||||||||||||||||||||||||||||||||||||||||||||||||||||||||||||||||||||||||||||||||||||||||||||||||||||||||||||||||||||||||||||||||||||||||||||||||||||||||||||||||||||||||||||||||||||||||||||||||||||||||||||||||||||||||||||||||||||||||||||||||||||||||||||||||||||||||||||||||||||||||||||||||||||||||||||||||||||||||||||||||||||||||||||||||||||||||||||||||||||||||||||||||||||||||||||||||||||||||||||||||||||||||||||||||||||||||||||||||||||||||||||||||||||||||||||||||||||||||||||||||||||||||||||||||||||||||||||||||||||||||||||||||||||||||||||||||||||||||||||||||||||||||||||||||||||||||||||||||||||||||||||||||||||||||||||||||||||||||||||||||||||||||||||||||||||||||||||||||||||||||||||||||||||||||||||||||||||||||||||||||||||||||||||||||||||||||||||||||||||||||||||||||||||||||||||||||||||||||||||||||||||||||||||||||||||||||||||||||||||||||||||||||||||||||||||||||||||||||||