PUBLIC HEALTH ASSESSMENT
Y-12 Uranium Releases
OAK RIDGE RESERVATION (USDOE)
OAK RIDGE, ANDERSON COUNTY, TENNESSEE
III. EVALUATION OF ENVIRONMENTAL CONTAMINATION AND POTENTIAL EXPOSURE PATHWAYS
In 2001, ATSDR scientists conducted a review and analysis of the Phase I and Phase II screening evaluation of TDOH's Oak Ridge Health Studies to identify contaminants that require further public health evaluation. In the Phase I and Phase II screening evaluation, the TDOH conducted extensive reviews of available information and conducted qualitative and quantitative analyses of past (1944–1990) releases and off-site exposures to hazardous substances from the entire ORR. On the basis of ATSDR's review and analysis of Phase I and Phase II screening evaluations, ATSDR scientists determined that past releases of uranium, mercury, iodine 131, fluorides, radionuclides from White Oak Creek, and PCBs require further public health evaluations. The public health assessment is the primary public health process ATSDR is using to further evaluate these contaminants. The public health assessment process will:
ATSDR scientists are conducting public health assessments on the following releases: Y-12 releases of uranium, Y-12 releases of mercury, X-10 release of iodine 131, X-10 release of radionuclides from White Oak Creek, K-25 releases of uranium and fluoride, and PCBs released from all three facilities. Public health assessments will also be conducted on other issues of concern, such as the Toxic Substances Control Act (TSCA) incinerator and off-site groundwater. ATSDR is also screening current (1990 to 2003) environmental data to determine whether additional chemicals will require further evaluation.
This public health assessment on the Y-12 uranium releases evaluates and analyzes the information, data, and findings of previous studies and investigations of releases of uranium from the Y-12 plant and assesses the health implications of past and current uranium exposures to residents living near the ORR, specifically the residents of the reference community (that is, Scarboro).
III.A.1. Exposure Evaluation
What is meant by exposure?
 ATSDR's public health assessments are driven by exposure or contact. Contaminants
(chemicals or radioactive materials) released into the environment have the
potential to cause harmful health effects. Nevertheless, a release does not
always result in exposure. People can only be exposed to a chemical contaminant
if they come into contact with that contaminant. If no one comes into contact
with a contaminant, then no exposure occurs, and thus no health effects could
occur. Often the general public does not have access to the source area of contamination
or areas where contaminants are moving through the environment. This lack of
access to these areas becomes important in determining whether people could
come into contact with the contaminants. In the case of radiological contamination,
however, exposure can occur without direct contact because of the emission of
radiation, which is a form of energy.
ATSDR's public health assessments are driven by exposure or contact. Contaminants
(chemicals or radioactive materials) released into the environment have the
potential to cause harmful health effects. Nevertheless, a release does not
always result in exposure. People can only be exposed to a chemical contaminant
if they come into contact with that contaminant. If no one comes into contact
with a contaminant, then no exposure occurs, and thus no health effects could
occur. Often the general public does not have access to the source area of contamination
or areas where contaminants are moving through the environment. This lack of
access to these areas becomes important in determining whether people could
come into contact with the contaminants. In the case of radiological contamination,
however, exposure can occur without direct contact because of the emission of
radiation, which is a form of energy.
The route of a contaminant's movement is the pathway. ATSDR identifies and evaluates exposure pathways by considering how people might come into contact with a contaminant. An exposure pathway could involve air, surface water, groundwater, soil, dust, or even plants and animals. Exposure can occur by breathing, eating, drinking, or by skin contact with a substance containing the chemical contaminant. Exposure to radiation can occur by being near the radioactive material.
How does ATSDR determine which exposure situations to evaluate?
ATSDR scientists evaluate specific conditions of the site to determine whether people are being exposed to site-related contaminants. When evaluating exposure pathways, ATSDR identifies whether exposure to contaminated media (soil, water, air, waste, or biota) is occurring through ingestion, dermal (skin) contact, or inhalation.
 If exposure is possible, ATSDR scientists then consider whether environmental
contamination is present at levels that might affect public health. ATSDR evaluates
environmental contamination using available environmental sampling data and,
in some cases, modeling studies. ATSDR selects contaminants for further evaluation
by comparing environmental contaminant concentrations against health-based comparison
values. Comparison values are developed by ATSDR from available scientific literature
concerning exposure and health effects. Comparison values are derived for each
of the media and reflect an estimated contaminant concentration that is not
expected to cause harmful health effects for a given contaminant, assuming a
standard daily contact rate (for example, the amount of water or soil consumed
or the amount of air breathed) and representative body weight.
If exposure is possible, ATSDR scientists then consider whether environmental
contamination is present at levels that might affect public health. ATSDR evaluates
environmental contamination using available environmental sampling data and,
in some cases, modeling studies. ATSDR selects contaminants for further evaluation
by comparing environmental contaminant concentrations against health-based comparison
values. Comparison values are developed by ATSDR from available scientific literature
concerning exposure and health effects. Comparison values are derived for each
of the media and reflect an estimated contaminant concentration that is not
expected to cause harmful health effects for a given contaminant, assuming a
standard daily contact rate (for example, the amount of water or soil consumed
or the amount of air breathed) and representative body weight.
Comparison values are not thresholds for harmful health effects. ATSDR comparison values represent contaminant concentrations that are many times lower than levels at which no effects were observed in studies on experimental animals or in human epidemiologic studies. If contaminant concentrations are above comparison values, ATSDR further analyzes exposure variables (such as site-specific exposure, duration, and frequency) for health effects, including the toxicology of the contaminant, other epidemiology studies, and the weight of evidence. Figure 7 illustrates ATSDR's chemical screening process.
More information about the ATSDR evaluation process can be found in ATSDR's Public Health Assessment Guidance Manual at http://www.atsdr.cdc.gov/HAC/HAGM/ or by contacting ATSDR at 1-888-42-ATSDR. An interactive program that provides an overview of the public health assessment process ATSDR uses to evaluate whether people will be harmed by hazardous materials is available at: http://www.atsdr.cdc.gov/training/public-health-assessment-overview/html/index.html.
If someone is exposed, will they get sick?
Exposure does not always result in harmful health effects. The type and severity of health effects that occur in an individual as the result of contact with a contaminant depend on the exposure concentration (how much), the frequency (how often) and duration of exposure (how long), the route or pathway of exposure (breathing, eating, drinking, or skin contact), and the multiplicity of exposure (combination of contaminants). Once exposure occurs, characteristics such as age, sex, nutritional status, genetics, lifestyle, and health status of the exposed individual influence how that individual absorbs, distributes, metabolizes, and excretes the contaminant. Taken together, these factors and characteristics determine the health effects that can occur as a result of exposure to a contaminant in the environment.
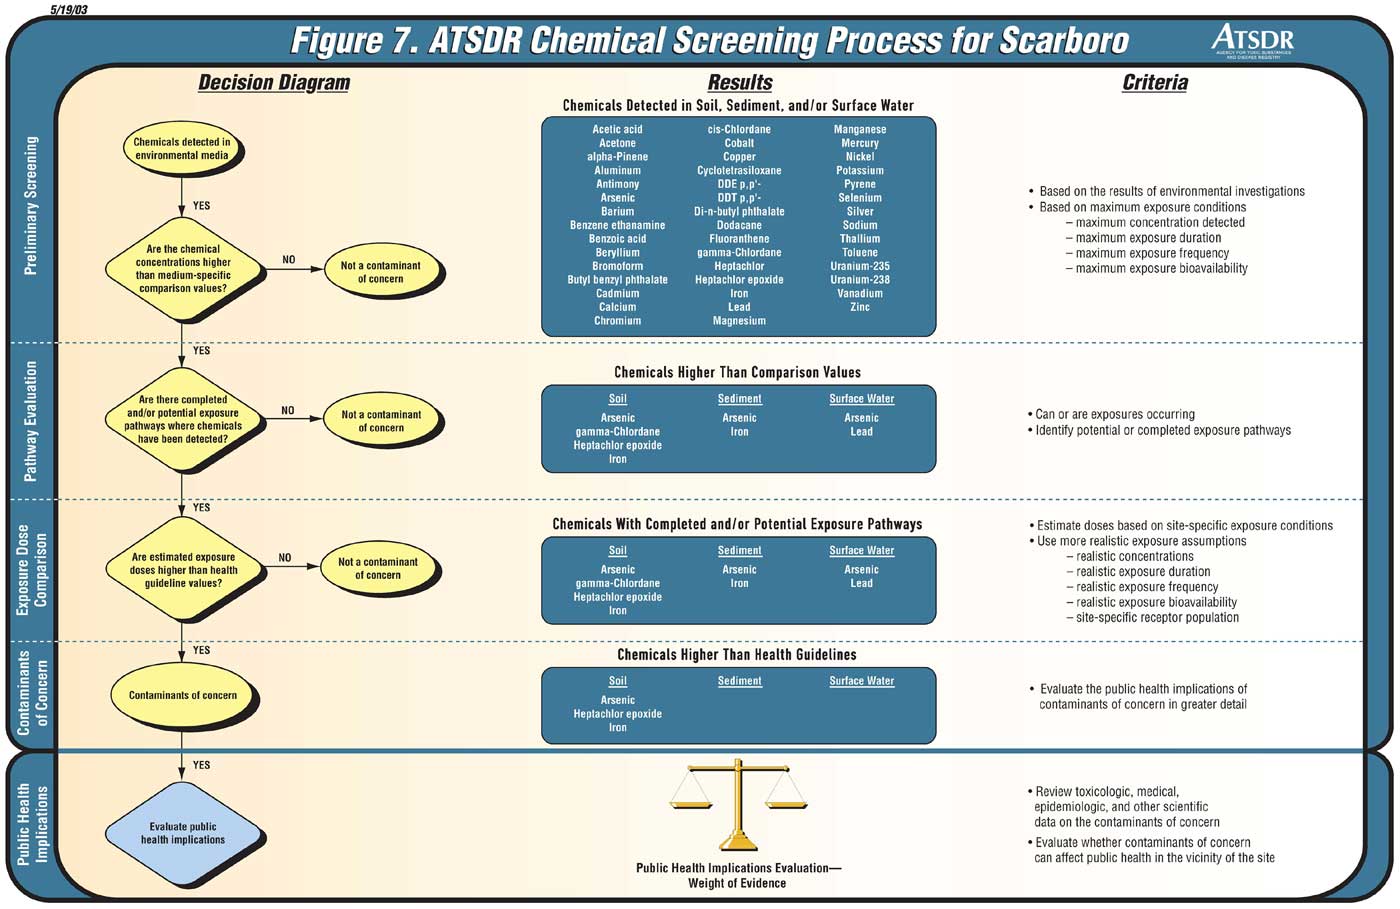
Figure 7. ATSDR Chemical Screening Process
To evaluate exposures to the reference population, Scarboro, ATSDR evaluated available past and current data to determine whether uranium concentrations were above natural background levels and/or ATSDR's comparison values. In the case of radiation doses, ATSDR calculated the doses based on site-specific data obtained from various environmental investigations and exposure factor sources. ATSDR also reviewed relevant toxicologic and epidemiologic data to obtain information about the toxicity of uranium (discussed in Appendix C). Both the chemical and radioactive properties of uranium can be harmful, and therefore they are evaluated separately.
It is important to remember that exposure to a certain contaminant does not always result in harmful health effects. The type and severity of health effects expected to occur depend on the exposure concentration, the toxicity of the contaminant, the frequency and duration of exposure, and the multiplicity of exposures.
III.A.2.a. Comparing Environmental Data to ATSDR's Comparison Values
 Comparison values are derived using conservative exposure assumptions and health-based
doses. Comparison values reflect concentrations that are much lower than those
that have been observed to cause adverse health effects. Thus, comparison values
are protective of public health in essentially all exposure situations. As a
result, concentrations detected at or below ATSDR's comparison values are
not considered to warrant health concern. While concentrations at or below
the relevant comparison value can reasonably be considered safe, it does not
automatically follow that any environmental concentration exceeding a comparison
value would be expected to produce adverse health effects. It cannot be emphasized
strongly enough that comparison values are not thresholds of toxicity. The
likelihood that adverse health outcomes will actually occur depends on site-specific
conditions, individual lifestyle, and genetic factors that affect the route,
magnitude, and duration of actual exposure; an environmental concentration alone
will not cause an adverse health outcome.
Comparison values are derived using conservative exposure assumptions and health-based
doses. Comparison values reflect concentrations that are much lower than those
that have been observed to cause adverse health effects. Thus, comparison values
are protective of public health in essentially all exposure situations. As a
result, concentrations detected at or below ATSDR's comparison values are
not considered to warrant health concern. While concentrations at or below
the relevant comparison value can reasonably be considered safe, it does not
automatically follow that any environmental concentration exceeding a comparison
value would be expected to produce adverse health effects. It cannot be emphasized
strongly enough that comparison values are not thresholds of toxicity. The
likelihood that adverse health outcomes will actually occur depends on site-specific
conditions, individual lifestyle, and genetic factors that affect the route,
magnitude, and duration of actual exposure; an environmental concentration alone
will not cause an adverse health outcome.
When evaluating chemical effects of uranium exposure, ATSDR scientists used comparison values that are specific to each environmental media. The comparison values used are shown in Table 2.
Table 2. Comparison Values for Uranium
| Media | Comparison Value | Source |
| Air | 0.3 µg/m3 | Chronic EMEG for highly soluble uranium salts |
| Surface water | 20 µg/L | Intermediate child EMEG for highly soluble uranium salts |
| Soil | 100 mg/kg | Intermediate child EMEG for highly soluble uranium salts |
| Fish | 4.1 mg/kg | RBC for soluble uranium salts |
µg/m3: microgram per cubic meter
µg/L: microgram per liter
mg/kg: milligram per kilogram
ATSDR's environmental media evaluation guides (EMEGs) are nonenforceable, health-based comparison values developed for screening environmental contamination for further evaluation. EPA's risk-based concentration (RBC) is a health-based comparison value developed to screen sites not yet on the NPL, respond rapidly to citizens' inquiries, and spot-check formal baseline risk assessments.
III.A.2.b. Comparing Estimated Doses to ATSDR's Minimal Risk Level and Other Comparison Values
Deriving exposure doses
 Exposure doses are expressed in milligrams per kilogram per day (mg/kg/day).
When estimating exposure doses, health assessors evaluate chemical concentrations
to which people could have been exposed, together with the length of time and
the frequency of exposure. Collectively, these factors influence an individual's
physiological response to chemical exposure and potential outcomes. Where possible,
ATSDR used site-specific information regarding the frequency and duration of
exposures. When site-specific information was not available, ATSDR employed
several conservative exposure assumptions to estimate exposures.
Exposure doses are expressed in milligrams per kilogram per day (mg/kg/day).
When estimating exposure doses, health assessors evaluate chemical concentrations
to which people could have been exposed, together with the length of time and
the frequency of exposure. Collectively, these factors influence an individual's
physiological response to chemical exposure and potential outcomes. Where possible,
ATSDR used site-specific information regarding the frequency and duration of
exposures. When site-specific information was not available, ATSDR employed
several conservative exposure assumptions to estimate exposures.
The following general equation was used to calculate chemical exposure doses:
where:
C: Concentration of uranium IR: Intake Rate EF: Exposure Frequency, or number of exposure events per year of exposure ED: Exposure Duration, or the duration over which exposure occurs BW: Body Weight AT: Averaging Time, or the period over which cumulative exposures are averaged
The following general equation was used for estimating the committed effective dose or the committed equivalent dose (organ) resulting from internal radiation exposure:
Estimated dose = C × IR × EF × DCF
where:
C: Concentration of uranium (expressed as picocuries per unit mass) IR: Intake Rate (mass per time period) EF: Exposure Frequency, or number of exposure events per year of exposure DCF: Dose Conversion Factor, dose coefficient as published by the International Commission on Radiological Protection (ICRP). The DCF takes into account a standard body weight of 70 kg.
Using the general equations given above, ATSDR derived toxicologic doses that residents living near the site may have received. As a first step, ATSDR compared these estimated site-specific doses against ATSDR's minimal risk levels (MRLs). MRLs are based on noncancer health effects only and are not based on a consideration of cancer effects. MRLs are derived when reliable and sufficient data exist to identify the target organs of effect or the most sensitive health effects for a specific duration for a given route of exposure. Proposed MRLs undergo a rigorous review process: Health Effects/MRL workgroup reviews within ATSDR's Division of Toxicology; expert panel of external peer reviews; and agency-wide MRL workgroup reviews, with participation from other federal agencies, including EPA; and are then submitted for public comment.
An MRL is an estimate of the daily human exposure to a hazardous substance that is likely to be without appreciable risk of adverse noncancer health effects over a specified duration of exposure. These substance-specific estimates, which are intended to serve as screening levels, are used by ATSDR health assessors to identify contaminants and potential health effects that are not expected to cause adverse health effects. It is important to note that MRLs are not intended to define cleanup or action levels. MRLs are intended only to serve as a screening tool to help public health professionals decide where to look more closely.
MRLs are derived for hazardous substances using the no-observed-adverse-effect level (NOAEL)/uncertainty factor approach. They are below levels that might cause adverse health effects in the people most sensitive to such effects. Most MRLs contain a degree of uncertainty because of the lack of precise toxicologic information on the people who might be most sensitive (for example, infants, the elderly, or persons who are nutritionally or immunologically compromised) to the effects of hazardous substances. Consistent with the public health principle of prevention, ATSDR uses a conservative (that is, protective) approach to address this uncertainty.
MRLs are generally based on the most sensitive end point considered to be of relevance to humans. Serious health effects (such as birth defects or irreparable damage to the liver or kidneys) are not used as a basis for establishing MRLs. Estimated doses that are less than these values are not considered to be of health concern. However, exposure to levels above the MRL does not automatically mean that adverse health effects will occur. To maximize human health protection, MRLs have built-in uncertainty or safety factors, making these values considerably lower than levels at which health effects have been observed. The result is that even if a dose is higher than the MRL, it does not necessarily follow that harmful health effects will occur. Rather, it is an indication that ATSDR should further examine the harmful effect levels reported in the scientific literature and more fully review exposure potential.
Table 3 shows the MRLs developed for uranium. Figures 8 and 9 compare the chemical doses and concentrations, respectively, for ingestion and inhalation of uranium. Figure 10 shows ATSDR's process of determining radiological doses. More detailed information is available in two ATSDR publications: the Toxicological Profile for Uranium (ATSDR 1999a) and the Toxicological Profile for Ionizing Radiation (ATSDR 1999b). Additional information about the toxicologic implications of uranium exposure is provided in Appendix C.
 Other Comparison Values
When evaluating the carcinogenic effects of radiation from uranium exposure, ATSDR scientists use the dose of 5,000 millirem (mrem) over 70 years as the radiogenic cancer comparison value. This value is a committed effective dose equivalent (CEDE) calculated from the intake of uranium, with the assumption that the entire dose (a 70-year dose, in this case)3 is received in the first year following the intake. Doses below this value are not expected to result in adverse health effects. ATSDR derived this value after reviewing the peer-reviewed literature and other documents developed to review the health effects of ionizing radiation (see Appendix D for more information about ATSDR's derivation of the radiogenic cancer comparison value of 5,000 mrem over 70 years).
III.A.2.c. Comparing Estimated Doses to Health Effects Levels
If the MRLs or radiogenic cancer comparison value are exceeded, ATSDR examines the health effects levels discussed in the scientific literature and more fully reviews exposure potential. ATSDR reviews available human studies as well as experimental animal studies. This information is used to describe the disease-causing potential of a particular chemical and to compare site-specific dose estimates with doses shown in applicable studies to result in illness (known as the margin of exposure). This process enables ATSDR to weight the available evidence in light of uncertainties and offer perspective on the plausibility of harmful health outcomes under site-specific conditions.
Table 3. ATSDR's Minimal Risk Levels (MRLs) for Uranium
| Route | Duration | Form | MRL Value | Dose Endpoint | Source |
| Inhalation | Intermediate | Soluble | 0.0004 mg/m3 | LOAEL; Minimal microscopic lesions in the renal tubules in half the dogs examined were observed at doses of 0.15 mg/m3. | Rothstein 1949a |
| Inhalation | Intermediate | Insoluble | 0.008 mg/m3 | NOAEL; No adverse health effects were observed in dogs exposed to doses of 1.1 mg/m3. | Rothstein 1949b |
| Inhalation | Chronic | Soluble | 0.0003 mg/m3 | NOAEL; No adverse health effects were observed in dogs exposed to doses of 0.05 mg/m3. | Stokinger et al. 1953 |
| Oral | Intermediate | 0.002 mg/kg/day | LOAEL; Renal toxicity was observed in rabbits exposed to doses of 0.05 mg/kg/day. | Gilman et al. 1998b | |
| External Radiation | Acute | Ionizing Radiation | 400 mrem | NOAEL; The difference of 0.3 IQ point in intelligence test scores between separated and unseparated identical twins is considered the NOAEL. | Burt 1966 |
| External Radiation | Chronic | Ionizing Radiation | 100 mrem/year | NOAEL; The annual dose of 360 mrem/year has not been associated with adverse health effects in humans or animals. | BEIR V 1990 |
Sources: ATSDR 1999a, 1999b
Acute duration is defined as less than or equal to 14 days.
Intermediate duration is defined as 15 to 364 days.
Chronic duration is defined as exposures exceeding 365 days.
The no-observed-adverse-effect level (NOAEL) is the highest dose of a chemical
in a study, or group of studies, that did not cause harmful health effects in
people or animals.
The lowest-observed-adverse-effect level (LOAEL) is the lowest dose of a chemical
in a study, or group of studies, that has caused harmful health effects in people
or animals.
The MRL level for intermediate-duration oral exposure is also protective for
chronic-duration oral exposure. This is because the renal effects of uranium
exposure are more dependent on the dose than on the duration of the exposure.
The rabbit is the mammalian species most sensitive to uranium toxicity and is
likely to be even more sensitive than humans.
mg/m3: milligram per cubic meter
mg/kg/day: milligram per kilogram per day
mrem: millirem
mrem/year: millirem per year

Figure 8. Comparison of Uranium Chemical Doses (Ingestion)
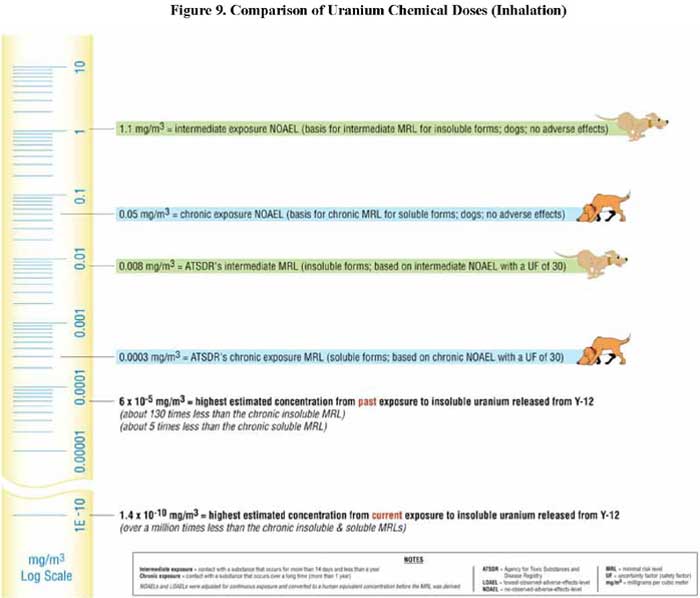
Figure 9. Comparison of Uranium Chemical Doses (Inhalation)
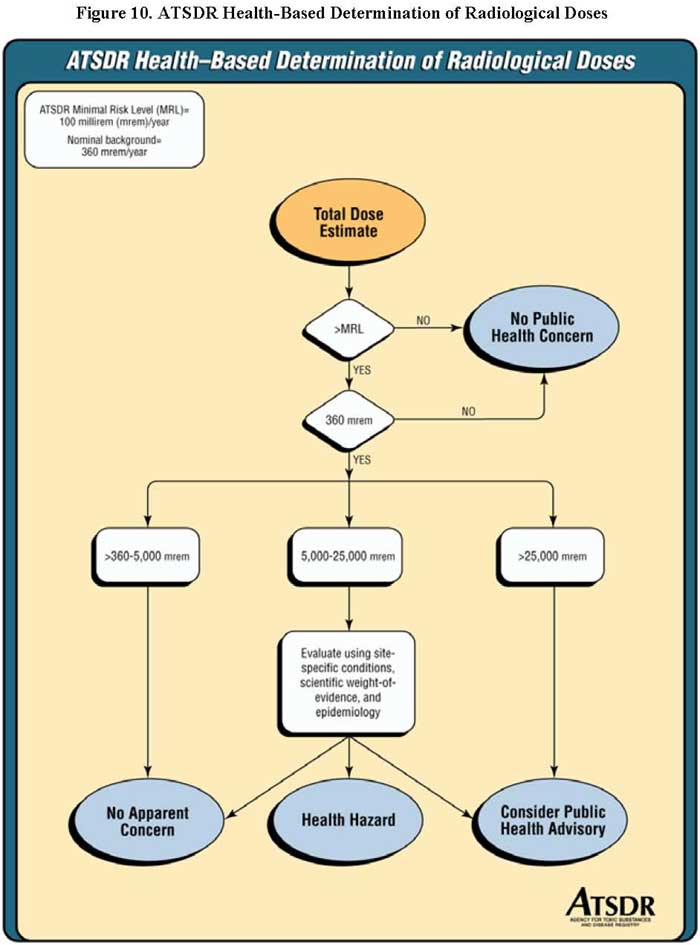
Figure 10. ATSDR Health-Based Determination of Radiological Doses
III.B. Public Health Evaluation
III.B.1. Past Exposure (1944-1995)
The meteorological data indicates that the predominate wind directions at the Y-12 plant are southwest and northeast, generally up and down Bear Creek valley, between Pine Ridge and Chestnut Ridge with limited winds crossing over the ridges. Most of the uranium would deposit up and down the Bear Creek valley and Union valley. However, no one lives in these valleys. The city of Oak Ridge is the only established community where residents resided during the years of uranium releases that could have been impacted by Y-12 uranium releases. The Scarboro community located within the city of Oak Ridge was selected as a reference location to estimate concentrations of uranium in the air, surface water, and soil in an off-site area where residents resided during years of past Y-12 plant uranium releases.
Furthermore, the Task 6 team identified Scarboro as the reference location using air dispersion modeling, specifically EPA's Industrial Source Complex Short Term (ISCST3) dispersion model, Version 96113 (USEPA 1995 as cited in ChemRisk 1999). Ground-level uranium air concentrations were estimated for a 40 by 47 kilometer grid to quantitatively relate past Y-12 plant uranium release rates to resulting average airborne uranium concentrations at locations surrounding the reservation. Using this method, the Task 6 team was able to identify off-site locations with the highest estimated uranium air concentrations. The Task 6 report stated that "while other potentially exposed communities were considered in the selection process, the reference locations [Scarboro] represent residents who lived closest to the ORR facilities and would have received the highest exposures from past uranium releases...Scarboro is the most suitable for screening both a maximally and typically exposed individual" (ChemRisk 1999). Scarboro represents an established community adjacent to the Y-12 plant with the highest estimated uranium air concentrations.
Therefore, in this evaluation, conclusions regarding exposure of Scarboro residents to uranium are also applicable to residents living in the city of Oak Ridge.
ATSDR evaluated both the radiation and chemical aspects of past uranium exposure. Neither the total radiation dose,4 nor the chemical ingestion and inhalation doses from exposure to uranium released from the Y-12 plant in the past would cause harmful health effects for people living near ORR, including those in the Scarboro community.
III.B.1.a. Past Radiation Effects
ATSDR used the screening results from the Task 6 report to evaluate past uranium releases to the environment from the Y-12 plant and past uranium exposures to residents living near the Y-12 plant. During the development of the Task 6 report, uranium radiation doses from the air, surface water, and soil pathways were estimated for the reference location, Scarboro, using a 52-year exposure scenario (Figure 11 shows the exposure pathways evaluated).
To evaluate potential radiation health effects to the population in Scarboro, ATSDR adjusted the Task 6 committed effective dose equivalents (CEDEs) to be equivalent to a 70-year exposure (see Table 4).5 The total past uranium radiation dose received by the reference population, the Scarboro community, from multiple routes of internal and external exposure pathways is a CEDE of 155 millirem (mrem) over 70 years. This total past radiation dose is well below (32 times less than) the ATSDR radiogenic cancer comparison value of a CEDE of 5,000 mrem over 70 years (see Figure 12). ATSDR derived this radiogenic cancer comparison value after reviewing the peer-reviewed literature and other documents developed to review the health effects of ionizing radiation (Appendix D provides more information about ATSDR's derivation of the radiogenic cancer comparison value of 5,000 mrem over 70 years). This radiogenic cancer comparison value assumes that from the intake of uranium, the entire radiation dose (a 70-year dose, in this case) is received in the first year following the intake. Doses below this value are not expected to result in adverse health effects. Therefore, ATSDR does not expect carcinogenic health effects (cancer) to have occurred from past radiation doses received from past Y-12 uranium releases.
To evaluate noncancer health effect from the total past uranium radiation dose (CEDE of 155 mrem over 70 years) received by the Scarboro community, an approximation can be made to compare the CEDE of 155 mrem, which is based on 70 years of exposure, to the ATSDR chronic exposure MRL for ionizing radiation (100 mrem/year), which is based on one year of exposure. The CEDE of 155 mrem over 70 years could be divided by 70 years to approximate a value of 2.2 mrem as the radiation dose in the first year which is well below (45 times less than) the 100 mrem/year ATSDR chronic exposure MRL for ionizing radiation (see Figure 12). The ATSDR MRLs are based on noncancer health effects only and are not based on a consideration of cancer effects. The ATSDR MRL of 100 mrem/year for chronic ionizing radiation exposure is derived by dividing the average annual effective dose to the U.S. population (360 mrem/year) by a safety factor of 3 to account for human variability (ATSDR 199b). The average U.S. annual effective dose of 360 mrem/year is obtained mainly from naturally occurring radioactive material, medical uses of radiation, and radiation from consumer products (see Figure 12) (BEIR V 1990 as cited in ATSDR 1999b). This average annual background effective dose of 360 mrem/year has not been associated with adverse health effects in humans or animals (ATSDR 1999b). ATSDR believes the chronic ionizing radiation MRL of 100 mrem/year is below levels that might cause adverse health effects in persons most sensitive to such effects; therefore, ATSDR does not expect noncancer health effects to have occurred from radiation doses received from past Y-12 uranium releases.
Table 4. Total Past Uranium Radiation Dose to the Scarboro Community
| Exposure Pathway | Isotope | Committed Effective Dose Equivalents (CEDE) in mrem over 70 years | Total CEDE for Each Exposure Pathway in mrem over 70 years |
| Sum of doses from the air pathway | U 234/235 | 34 | 40 |
| U 238 | 6 | ||
| Sum of doses from the surface water (EFPC) pathway | U 234/235 | 27 | 49 |
| U 238 | 22 | ||
| Sum of doses from the soil pathway | U 234/235 | 38 | 66 |
| U 238 | 28 | ||
| Total across all media | U 234/235 | 99 | 155 |
| U 238 | 56 |
Source: ChemRisk 1999
The Task 6 level II CEDEs were converted from Sievert (Sv) to mrem by multiplying by 105. In addition, the values were multiplied by 1.35 (i.e., 70 years/52 years) for comparison with the ATSDR radiogenic cancer comparison value, which is based on a 70-year exposure.

Figure 11. Exposure Pathways Evaluated

Figure 12. Comparison of Radiation Doses
Additionally, it should be noted that several levels of conservatism were built into the Task 6 evaluation of past exposures. The Task 6 values that ATSDR relied on to evaluate past exposures came from a screening evaluation that routinely and appropriately used conservative and protective assumptions and approaches, which led to an overestimation of concentrations and doses. Even using these overestimated concentrations and doses, persons in the reference community, Scarboro, were exposed to levels of uranium that are not expected to cause health effects. Following is a list of conservative aspects in this evaluation.
This conservatism and overestimation, used in the Task 6 evaluation, resulted in overestimation of radiation doses from uranium that the reference population, Scarboro, was exposed to in the past; however, even those overestimated doses were below levels of health concern. Therefore, residents living near the Y-12 plant would not be expected to have any adverse health effects from past exposure to uranium. Each past exposure pathway is evaluated separately in the following sections.
The Task 6 team independently evaluated past Y-12 airborne uranium releases and generated release estimates much higher than those previously reported by DOE (see Figure 13 and Table 5). They attributed the difference to DOE's use of incomplete sets of effluent monitoring data and release documents, along with their use of release estimates based on effluent monitoring data not adequately corrected to account for sampling biases (ChemRisk 1999). It is ATSDR's understanding that DOE and the community have not disputed the release estimates generated by the Task 6 team. Please see Section 2.0 in the Task 6 report for more details about how the airborne uranium release estimates were determined.
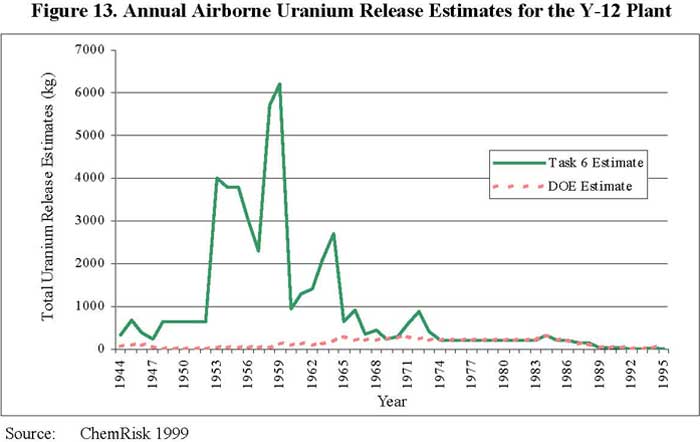
Figure 13. Annual Airborne Uranium Release Estimates for the Y-12 Plant
Table 5. Annual Airborne Uranium Release Estimates for the Y-12 Plant (1944-1995)
| Year | Task 6 Estimate (kg) | DOE Estimate (kg) | Year | Task 6 Estimate (kg) | DOE Estimate (kg) |
| 1944 | 310 | 55 | 1970 | 300 | 259 |
| 1945 | 670 | 102 | 1971 | 580 | 290 |
| 1946 | 390 | 102 | 1972 | 870 | 222 |
| 1947 | 250 | 55 | 1973 | 410 | 206 |
| 1948 | 650 | 0 | 1974 | 210 | 207 |
| 1949 | 650 | 0 | 1975 | 210 | 209 |
| 1950 | 650 | 0 | 1976 | 210 | 207 |
| 1951 | 650 | 0 | 1977 | 210 | 206 |
| 1952 | 650 | 0 | 1978 | 210 | 205 |
| 1953 | 4,000 | 30 | 1979 | 210 | 206 |
| 1954 | 3,800 | 32 | 1980 | 220 | 218 |
| 1955 | 3,800 | 32 | 1981 | 210 | 207 |
| 1956 | 3,000 | 43 | 1982 | 210 | 207 |
| 1957 | 2,300 | 41 | 1983 | 210 | 208 |
| 1958 | 5,700 | 41 | 1984 | 330 | 329 |
| 1959 | 6,200 | 120 | 1985 | 210 | 210 |
| 1960 | 930 | 99 | 1986 | 210 | 211 |
| 1961 | 1,300 | 109 | 1987 | 150 | 116 |
| 1962 | 1,400 | 100 | 1988 | 150 | 116 |
| 1963 | 2,100 | 103 | 1989 | 44* | 44 |
| 1964 | 2,700 | 170 | 1990 | 21* | 21 |
| 1965 | 640 | 281 | 1991 | 21* | 21 |
| 1966 | 920 | 212 | 1992 | 7* | 7 |
| 1967 | 340 | 212 | 1993 | 3* | 3 |
| 1968 | 440 | 211 | 1994 | 24* | 24 |
| 1969 | 250 | 223 | 1995 | 2* | 2 |
| Total | 50,000 | 6,535 |
Source: ChemRisk 1999
* Values for 1989 to 1995 were based on releases reported by DOE. Release estimates for these years were not independently reconstructed during the dose reconstruction.
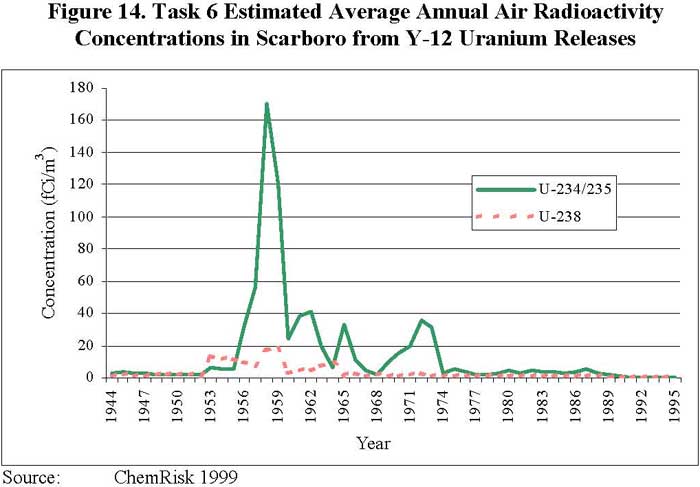
Using Task 6's newly generated annual airborne uranium release estimates for the Y-12 plant from 1944 to 1995 and the measured air radioactivity concentrations from DOE air monitoring station 46, located in the reference location of Scarboro, from 1986–1995 (DOE began monitoring station 46 in 1986), the Task 6 team used an empirical c/Q (c is chi) approach to estimate average annual air radioactivity concentrations in Scarboro from the 1944 to 1995 Y-12 plant uranium releases (see Figure 14 and Table 6). The empirical c/Q is the ratio of measured air radioactivity concentration (air monitoring station 46 data) to release rate (Task 6 annual airborne uranium release estimates). Please see Section 3.0 in the Task 6 report for more details about how the uranium air concentrations were estimated.
The Task 6 team used these average annual U 234/235 and U 238 air radioactivity concentrations based on the empirical c/Q method to calculated past uranium CEDEs to the Scarboro community via the air exposure pathways. These past uranium CEDEs for each air exposure pathway in Scarboro were summed to calculate the past U 234/235 CEDE of 34 mrem and the past U 238 CEDE of 6 mrem from the air pathway (see Table 4). The total uranium CEDE from the air exposure pathway in Scarboro, after being adjusted to reflect a 70-year exposure, is 40 mrem.
The Task 6 report noted that late in the project it was ascertained that the Y-12 uranium releases for some of the years used to develop the empirical c/Q value may have been understated (ChemRisk 1999). This would cause the empirical c/Q values to also be overestimated and in turn would cause the estimated average air radioactivity concentrations in Scarboro to be overestimated (ChemRisk 1999).
Table 6. Task 6 Estimated Average Annual Air Radioactivity Concentrations in Scarboro from Y-12 Uranium Releases (1944-1995)
| Year | U 234/235 (fCi/m3) | U 238 (fCi/m3) | Year | U 234/235 (fCi/m3) | U 238 (fCi/m3) |
| 1944 | 2.4 | 1.1 | 1970 | 15 | 0.91 |
| 1945 | 4.0 | 2.2 | 1971 | 20 | 1.8 |
| 1946 | 3.0 | 1.3 | 1972 | 36 | 2.7 |
| 1947 | 2.5 | 0.81 | 1973 | 31 | 1.2 |
| 1948 | 1.6 | 2.1 | 1974 | 2.7 | 0.67 |
| 1949 | 1.6 | 2.1 | 1975 | 5.0 | 0.67 |
| 1950 | 1.6 | 2.1 | 1976 | 3.2 | 0.67 |
| 1951 | 1.6 | 2.1 | 1977 | 1.6 | 0.67 |
| 1952 | 1.6 | 2.1 | 1978 | 1.7 | 0.67 |
| 1953 | 6.5 | 13 | 1979 | 2.3 | 0.67 |
| 1954 | 5.6 | 12 | 1980 | 4.6 | 0.71 |
| 1955 | 5.7 | 12 | 1981 | 2.8 | 0.67 |
| 1956 | 31 | 10 | 1982 | 4.7 | 0.66 |
| 1957 | 56 | 7.8 | 1983 | 4.0 | 0.67 |
| 1958 | 170 | 17 | 1984 | 3.4 | 1.1 |
| 1959 | 120 | 19 | 1985 | 2.7 | 0.68 |
| 1960 | 24 | 3.0 | 1986 | 3.4 | 0.69 |
| 1961 | 38 | 4.2 | 1987 | 5.7 | 0.48 |
| 1962 | 41 | 4.5 | 1988 | 2.9 | 0.47 |
| 1963 | 20 | 6.8 | 1989 | 1.4 | 0.024 |
| 1964 | 6.5 | 8.8 | 1990 | 0.77 | 0.014 |
| 1965 | 33 | 2.0 | 1991 | 0.38 | 0.063 |
| 1966 | 11 | 3.0 | 1992 | 0.36 | 0.022 |
| 1967 | 1.9 | 1.1 | 1993 | 0.29 | 0.0093 |
| 1968 | 2.2 | 1.4 | 1994 | 0.31 | 0.078 |
| 1969 | 9.4 | 0.77 | 1995 | 0.17 | 0.0055 |
Source: ChemRisk 1999
fCi/m3 is femtocuries per cubic meter. 1 femtocurie
equals 1 × 10-15 curies.
Concentrations were estimated using the empirical c/Q
approach.
All values are rounded to two significant figures.
ATSDR evaluated the Task 6 methodology for estimating annual average air radioactivity concentrations in Scarboro from Y-12 uranium releases relative to measured uranium air radioactivity concentrations at the DOE air monitoring station 46 in Scarboro from 1986 to 1995. According to ATSDR's evaluation, the Task 6 empirical c/Q estimation of the average U 234/235 air radioactivity concentrations consistently overestimated the concentrations in Scarboro from 1986 to 1995 (see Figure 15). In addition, estimated average U 238 air radioactivity concentrations using the Task 6 empirical c/Q method overestimated or slightly underestimated measured U 238 air radioactivity concentrations (see Figure 16). A detailed discussion of linear regression evaluation by ATSDR is provided in Appendix E.
Consequently, the estimated average U 234/235 and U 238 air radioactivity concentrations at Scarboro from 1945 to 1995 Y-12 uranium releases (see Table 6) are most likely overestimated because these concentrations are based on the Task 6 empirical c/Q value. In addition, the Task 6 team used these likely overestimated average U 234/235 and U 238 air radioactivity concentrations based on the empirical c/Q method to calculated past uranium CEDEs to the Scarboro community via the air exposure pathways (see Table 7 for a list of air exposure pathways considered by the Task 6 team). As shown in Table 7, the majority of the estimated total radiation dose via the air pathway in Scarboro from Y-12 uranium releases is attributed to inhalation of airborne particles.
Table 7. Air Pathways Considered by the Task 6 Team
| Exposure Pathway to Humans | % Pathway Contributes to Total Radiation Dose | |
| U 234/235 | U 238 | |
| Inhalation of airborne particles | 30% | 10% |
| Direct contact with air containing uranium particulates | <1% | <1% |
| Ingestion of meat from livestock that inhaled airborne particles | <1% | <1% |
| Ingestion of milk from dairy cows that inhaled airborne particles | <1% | <1% |
| Consumption of vegetables contaminated with deposited particles | 4% | <1% |
| Consumption of meat from livestock that ate pasture contaminated with deposited particles | <1% | <1% |
| Consumption of milk from dairy cows that ate pasture contaminated with deposited particles | <1% | <1% |
Source: ChemRisk 1999
To calculate an estimated uranium radiation dose, the Task 6 team used the latest dose coefficients recommended by the ICRP (ChemRisk 1999). Dose coefficients are a combination of factors that may contain uncertainty with respect to physiological parameters. In the case of uranium, the physiological parameters related to dose assessment are well known. Therefore, the uncertainties in the assessment of uranium doses are more precise than other radionuclides. Please see Appendix F for additional information about the ICRP's dose coefficients (for examples, see Harrison et al. 2001; Leggett 2001).
Past Surface Water Exposure Pathway
The closest surface water body to the reference location, Scarboro, is EFPC, which originates from within the Y-12 plant boundary, flows through the city of Oak Ridge, and confluences with Poplar Creek (ChemRisk 1999). EFPC passes about 0.4 miles to the northeast of the populated area of Scarboro at its closest point (ChemRisk 1999). EFPC represents the most credible source of surface water exposure for Scarboro residents (ChemRisk 1999). Public access to the creek exists after it leaves the reservation. However, the creek appears to be too shallow for swimming, although some areas are suitable for wading and fishing.
To calculate annual average uranium radioactivity concentrations in EFPC from 1944 to 1995, the Task 6 team divided the annual waterborne uranium release estimates from the Y-12 plant by the EFPC annual flow rate (see Figure 17 and Table 8). Please see Section 3.3 in the Task 6 report for more details about how the uranium surface water concentrations were determined.

Figure 17. Average Annual Uranium Concentrations in EFPC Surface Water
The Task 6 team then calculated estimated CEDEs via the EFPC surface water exposure pathways. The total past uranium CEDE from EFPC surface water exposure pathways, after being adjusted to reflect a 70-year exposure6 , is 49 mrem (see Table 4). As shown in Table 9, the majority of the exposure to uranium is attributed to frequently eating fish from EFPC (24% of the total U 234/235 dose and 35% of the total U 238 dose). It is ATSDR's understanding that EFPC is not a very productive fishing location and very few people actually eat fish from the creek. If a person did not frequently eat EFPC fish over a prolonged period of time, the person's uranium radioactivity dose from the surface water pathway would be expected to be substantially lower than the estimated radioactivity doses reported in this public health assessment.
As with the air pathway, to calculate an estimated uranium radiation dose for the surface water pathway, the Task 6 team used the dose coefficients recommended by the ICRP (ChemRisk 1999). Please see Appendix F for additional information about the ICRP's dose coefficients (for examples, see Harrison et al. 2001; Leggett 2001).
Table 8. Average Annual Uranium Concentrations in East Fork Poplar Creek Surface Water (1944-1995)
| Year | Total Uranium (pCi/L) | U 238 (pCi/L) | U 234/235 (pCi/L) | Uranium (mg/L) | Year | Total Uranium (pCi/L) | U 238 (pCi/L) | U 234/235 (pCi/L) | Uranium (mg/L) |
| 1944 | 2,100 | 1,000 | 1,100 | 3.0 | 1970 | 560 | 270 | 290 | 0.79 |
| 1945 | 450 | 210 | 240 | 0.63 | 1971 | 230 | 110 | 120 | 0.32 |
| 1946 | 450 | 210 | 240 | 0.63 | 1972 | 190 | 92 | 100 | 0.27 |
| 1947 | 450 | 210 | 240 | 0.63 | 1973 | 71 | 34 | 37 | 0.099 |
| 1948 | 99 | 47 | 52 | 0.14 | 1974 | 99 | 47 | 52 | 0.14 |
| 1949 | 290 | 140 | 150 | 0.41 | 1975 | 104 | 50 | 55 | 0.15 |
| 1950 | 9.1 | 4.3 | 4.8 | 0.013 | 1976 | 87 | 42 | 46 | 0.12 |
| 1951 | 6.2 | 2.9 | 3.3 | 0.0088 | 1977 | 48 | 23 | 25 | 0.067 |
| 1952 | 0.0070 | 0.0033 | 0.0037 | 0.000010 | 1978 | 26 | 12 | 14 | 0.036 |
| 1953 | 61 | 29 | 32 | 0.085 | 1979 | 23 | 11 | 12 | 0.033 |
| 1954 | 71 | 34 | 37 | 0.099 | 1980 | 9.9 | 4.7 | 5.2 | 0.014 |
| 1955 | 68 | 32 | 36 | 0.095 | 1981 | 44 | 21 | 23 | 0.062 |
| 1956 | 320 | 150 | 170 | 0.45 | 1982 | 54 | 25 | 28 | 0.075 |
| 1957 | 540 | 260 | 280 | 0.76 | 1983 | 110 | 54 | 60 | 0.16 |
| 1958 | 640 | 300 | 340 | 0.89 | 1984 | 110 | 54 | 60 | 0.16 |
| 1959 | 660 | 320 | 350 | 0.93 | 1985 | 50 | 24 | 26 | 0.070 |
| 1960 | 640 | 300 | 340 | 0.90 | 1986 | 42 | 20 | 22 | 0.058 |
| 1961 | 200 | 93 | 100 | 0.27 | 1987 | 42 | 20 | 22 | 0.058 |
| 1962 | 14.8 | 7.0 | 7.8 | 0.021 | 1988 | 42 | 20 | 22 | 0.058 |
| 1963 | 80 | 38 | 42 | 0.11 | 1989 | 42 | 20 | 22 | 0.058 |
| 1964 | 420 | 200 | 220 | 0.59 | 1990 | 42 | 20 | 22 | 0.058 |
| 1965 | 570 | 270 | 300 | 0.79 | 1991 | 42 | 20 | 22 | 0.058 |
| 1966 | 510 | 240 | 270 | 0.71 | 1992 | 42* | 20* | 22* | 0.058* |
| 1967 | 970 | 460 | 510 | 1.4 | 1993 | 42* | 20* | 22* | 0.058* |
| 1968 | 1,100 | 530 | 590 | 1.6 | 1994 | 42* | 20* | 22* | 0.058* |
| 1969 | 270 | 130 | 140 | 0.38 | 1995 | 42* | 20* | 22* | 0.058* |
| EFPC Average Concentrations (1944-1995) | 121 | 134 | 0.36 | ||||||
Source: ChemRisk 1999
*Assumed same concentration as 1991.
All values are rounded to two significant figures.
Table 9. Surface Water Pathways Considered
by the Task 6 Team
| Exposure Pathway to Humans | % Pathway Contributes to Total Radiation Dose | |
| U 234/235 | U 238 | |
| Incidental ingestion of EFPC water | <1% | <1% |
| Ingestion of meat from livestock that drank water from EFPC | <1% | <1% |
| Ingestion of milk from dairy cows that drank water from EFPC | 2% | 3% |
| Consumption of fish from EFPC | 24% | 35% |
| Immersion in EFPC water | <1% | <1% |
Source: ChemRisk 1999
At the beginning of the Task 6 dose reconstruction, uranium soil data from the reference location, Scarboro, were not available. In its place, uranium soil data from the EFPC floodplain were used as a surrogate for past uranium radioactivity concentrations in Scarboro soil (ChemRisk 1999). The Task 6 team used the average soil concentrations of U 234/235 and U 238 collected from EFPC floodplain between the Y-12 boundary and EFPC MILE 8.8 to estimate past uranium radioactivity doses via the soil pathways in Scarboro. Please see Section 3.4 in the Task 6 report for more details about how uranium concentrations in soil were determined.
The Task 6 report noted that the use of uranium concentrations in EFPC floodplain soil to represent uranium concentrations in Scarboro soil, which is outside of the floodplain, probably introduced conservatism (ChemRisk 1999). The Task 6 report also noted that the uranium concentrations in EFPC floodplain soil, which were available at that time, were not sufficient to support a defensible analysis of average or typical exposure to members of the Scarboro community during the years from the community's inception to the present (ChemRisk 1999).
The Task 6 team estimated past uranium radiation doses by using uranium radioactivity concentrations in EFPC floodplain soil to calculate estimated CEDEs via the soil exposure pathways to residents of Scarboro. The total past uranium CEDE from the soil pathway, after being adjusted to reflect a 70-year exposure7, is 66 mrem (see Table 4). As shown in Table 10, the majority of the past uranium radiation dose (30% of the total U 234/235 dose and 43% of the total U 238 dose) for the soil pathways is attributed to frequently eating vegetables grown in contaminated floodplain soil over a prolonged period of time. If a person did not frequently eat homegrown vegetables over a prolonged period of time, the person's uranium dose from the soil pathway would have been substantially lower than the estimated doses reported in this public health assessment.
Table 10. Soil Pathways Considered by the Task 6 Team
| Exposure Pathway to Humans | % Pathway Contributes to Total Radiation Dose | |
| U 234/235 | U 238 | |
| Inhalation of resuspended dust | 2% | 3% |
| Ingestion of soil | <1% | 1% |
| Consumption of meat from livestock that ingested soil | <1% | <1% |
| Consumption of milk from dairy cows that ingested soil | <1% | 1% |
| Consumption of vegetables grown in contaminated soil | 30% | 43% |
| Consumption of meat from livestock that ate pasture grown in contaminated soil | <1% | <1% |
| Consumption of milk from dairy cows that ate pasture grown in contaminated soil | <1% | 1% |
| External exposure to contaminated soil | 3% | <1% |
Source: ChemRisk 1999
Toward the end of the Task 6 project (in May 1998), 40 soil samples from the Scarboro community were collected by the Environmental Sciences Institute at FAMU (FAMU 1998). In 2001, EPA collected six additional soil samples from the Scarboro community to validate the 1998 FAMU results (EPA 2003). An independent review by Auxier & Associates (Prichard 1998) of the Task 6 report and the report generated by FAMU noted that aerial deposition of uranium was the primary source of uranium contamination in Scarboro soil, rather than the transportation of EFPC floodplain soils for use as fill. It was concluded that the radioactivity concentrations of uranium within the Task 6 report (based on EFPC floodplain soil samples) are inconsistent with the radioactivity concentrations of uranium observed in Scarboro soils and that the Task 6 assumptions are unlikely to accurately represent past uranium radioactivity concentrations in Scarboro soil (Prichard 1998). Additionally, technical reviews of the Auxier report, the Task 6 report, and the report generated by FAMU noted that the use of actual Scarboro soil data is preferable to the reliance on floodplain soil data. However, the reviewers cautioned using the FAMU data to estimate past exposure without additional research into the environmental distribution of uranium in the area8. Appendix G contains a summary of the technical reviewers' comments.
Based on the FAMU and EPA uranium soil data, the actual uranium radioactivity concentrations in Scarboro soil were much lower than the uranium radioactivity concentrations from the EFPC floodplain soil that the Task 6 team used as a surrogate. As shown in Figure 18 and Table 11, the actual uranium radioactivity concentrations in Scarboro soil are approximately 8 to 22 times less than the EFPC floodplain soil concentrations. Consequently, if the uranium radioactivity concentrations from Scarboro soil were used to estimate the past uranium radioactivity doses instead of the EFPC floodplain soil, the total past uranium CEDE of 66 mrem for the soil exposure pathway (see Table 4) would have been significantly lower.
As with the air and surface water pathways, to calculate an estimated uranium radiation dose for the soil exposure pathway, the Task 6 team used the dose coefficients recommended by the ICRP (ChemRisk 1999). Please see Appendix F for additional information about the ICRP's dose coefficients.
Table 11. Comparison of Average Uranium
Radioactivity Concentrations
EFPC Floodplain Soil vs. Scarboro Soil
| Average U 234 Concentration (pCi/g) | Average U 235 Concentration (pCi/g) | Average U 238 Concentration (pCi/g) | ||
| Task 6: Floodplain Soil | 12 | 2 | 12 | |
| EPA: Scarboro Soil | 1.2 | 0.1 | 1.0 | |
| FAMU: Scarboro Soil | not available | 0.09 | 1.4 | |
| How much lower are the soil radioactivity concentrations in Scarboro than the EFPC floodplain? | Task 6 vs. EPA | 10 times | 20 times | 12 times |
| Task 6 vs. FAMU | not available | 22 times | 8.6 times | |
Sources: ChemRisk 1999, EPA 2003, FAMU 1998
Next Section Table
of Contents