Palo Verde Nuclear Generating Station, Arizona
Next Update: September 2009
Palo Verde Nuclear Generating Station
Net Generation and Capacity, 2007
Unit |
Net Capacity |
Generation |
Capacity |
Type |
On Line |
License |
1 |
1,311 |
8,841.133 |
77.0 |
PWR |
Jan. 28, 1986 |
Dec. 31, 2024 |
2 |
1,314 |
10,957.595 |
95.2 |
PWR |
Sept. 19, 1986 |
Dec. 9, 2025 |
3 |
1,247 |
6,983.663 |
63.9 |
PWR |
Jan. 8, 1988 |
March 25, 2027 |
Total |
3,875 |
26,782.391 |
79.0 |
|
- |
- |
PWR = Pressurized Light Water Reactor |
||||||
Palo Verde Nuclear Power Plant, Uprates
The U.S. Nuclear Regulatory Commission (NRC) approved a 2 percent up rate for each reactor (76 MegaWatts, each) on May 23, 1996. On November 16, 2005, both units 1 and 3 were approved for a 2.9 percent uprate (114 MegaWatts each). No other uprate applications are currently pending for this plant.
Description: Palo Verde is one of the few power plants in the Nation that contain three reactors (no U.S. power plants have more than three, although some foreign plants have more than four). According to preliminary data, unit two was up rated in capacity and is now the Nation's largest. Palo Verde is located in Maricopa County, on a 4,050-acre site near Wintersburg, Arizona. On November 18, 2005, the U.S. Nuclear Regulatory Commission announced approval of uprates at two of Palo Verde's reactors. According to the NRC press release, "The power uprates at each unit, located near Phoenix, Arizona, increases the net generating capacity of the reactors from 1270 to 1313 and 1317 megawatts electric, respectively, for Units 1 and 3. The licensee intends to implement the uprate by the end of December for Unit 1, and by the end of 2007 for Unit 3."
Palo Verde, Unit 1
Nuclear Steam System Supplier (NSSS Vendor) = Combustion Engineering (CE80, CE Standard Design)
Architect Engineer = Bechtel
Owner = (See Table)
Operator (Licensee) = Arizona Nuclear Power Project
Plant Operator and Ownership,* 2004
Operator |
Owner |
Share |
||
Arizona Public Svc |
Arizona Public Svc |
29.10 |
||
|
Salt River Project |
17.49 |
||
|
Southern California Edison Company |
15.80 |
||
|
El Paso Electric Co |
15.80 |
||
|
Public Service Co. of New Mexico |
10.20 |
||
|
Southern California Public Power Auth |
5.91 |
||
|
City of Los Angeles |
8.70 |
||
|
Total |
100 |
||
| * The Pinnacle West Corporation's holdings include the Palo Verde Plant. Their largest affiliate, Arizona Public Service (APS) is the operator and co-owner. | ||||
Palo Verde, Unit 2
Nuclear Steam System Supplier (NSSS Vendor) = Combustion Engineering (CE80, CE Standard Design)
Architect Engineer = Bechtel
Owner = (See Table)
Operator (Licensee) = Arizona Nuclear Power Project
Palo Verde, Unit 3
Nuclear Steam System Supplier (NSSS Vendor) = Combustion Engineering (CE80, CE Standard Design)
Architect Engineer = Bechtel
Owner = (See Table)
Operator (Licensee) = Arizona Nuclear Power Project
Containment: According to the U.S. Nuclear Regulatory Commission, all three reactors are dry, ambient pressure containment.
Pressurized-Water Reactor (PWR)
In a typical commercial pressurized light-water reactor (1) the reactor core generates heat, (2) pressurized-water in the primary coolant loop carries the heat to the steam generator, (3) inside the steam generator heat from the primary coolant loop vaporizes the water in a secondary loop producing steam, (4) the steam line directs the steam to the main turbine causing it to turn the turbine generator, which produces electricity. The unused steam is exhausted to the condenser where it is condensed into water. The resulting water is pumped out of the condenser with a series of pumps, reheated, and pumped back to the steam generator. The reactors core contains fuel assemblies which are cooled by water, which is force-circulated by electrically powered pumps. Emergency cooling water is supplied by other pumps, which can be powered by onsite diesel generators. Other safety systems, such as the containment cooling system, also need power.
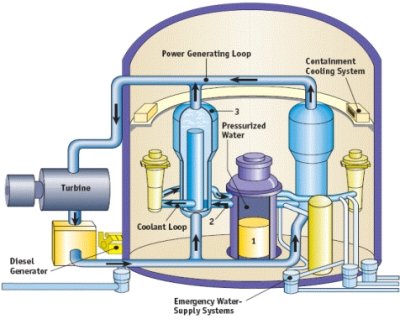 |
| © U.S. Nuclear Regulatory Commission (used with permission). |
_________________________________________
Sources
for Data in Table: Capacity,
for purposes of this report, is the net summer capacity as reported
in Energy Information Administration (EIA) Form EIA-860, "Annual
Electric Generator Report." Capacity Factor is
a percentage calculation in which the maximum possible generation
(based on net summer capability) is divided into the actual generation
then multiplied by 100. Generation is the net electricity
output reported by plant owners on Form EIA-906, “Power Plant
Report.” Reactor Type: All U.S. commercial
reactors currently in operation are one of two types: BWR (boiling
water reactor) or PWR (pressurized water reactor).
The type, on-line date, and the license expiration date are published
annually in Information Digest by the U.S. Nuclear Regulatory
Commission.