St. Lucie Nuclear Power Plant, Florida
Next Update: September 2009
St. Lucie Nuclear Power Plant
Net Generation and Capacity, 2007
Unit |
Net Capacity |
Generation |
Capacity |
Type |
On Line |
License |
| 1 | 839 | 6,235.76 | 84.8 | PWR | Mar. 1, 1976 | Mar. 1, 2036 |
| 2 | 839 | 5,153.74 | 70.1 | PWR | Jun. 10, 1983 | Apr. 6, 2043 |
| 1,678 | 11,389.50 | 77.5 | ||||
| * On October 2, 2003, t he NRC approved the license renewal application for units 1 and 2 at the St. Lucie nuclear power plant. Prior to this action, the license for unit 1 expired in 2016 and for unit 2, the license would have expired in 2023. PWR = Pressurized-Water Reactor. Sources |
||||||
Description: The St. Lucie power plant is located on a 1,130-acre site near Ft. Pierce, Florida.
Ownership:
| Plant Operator and Ownership, 2007 | ||
| Operator | Owner | Share (Percent) |
| Unit 1 | ||
| Florida Power & Light Company | Florida Power & Light Company | 100 |
| Unit 2 | ||
| Florida Power & Light Company | Florida Power & Light Company | 85.11 |
| Florida Municipal Power Agency | 8.81 | |
| Orlando Public Utilities Commission | 6.08 | |
| Total | 100 | |
St. Lucie, Unit 1
Nuclear Steam System Supplier (NSSS Vendor) = Combustion Engineering
Architect Engineer = Ebasco
Owner: Florida Power & Light Company
Operator = Florida Power & Light Company
St. Lucie, Unit 2
Nuclear Steam System Supplier (NSSS Vendor) = Combustion Engineering
Architect Engineer = Ebasco
Owner = Florida Power & Light Company is majority owner of unit 2
Operator (Licensee) = Florida Power & Light Company
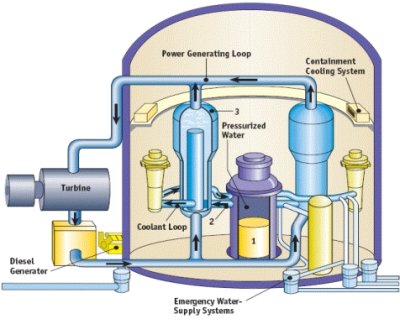
Pressurized-Water Reactor (PWR)
In a typical commercial pressurized light-water reactor (1) the reactor core generates heat, (2) pressurized-water in the primary coolant loop carries the heat to the steam generator, (3) inside the steam generator heat from the primary coolant loop vaporizes the water in a secondary loop producing steam, (4) the steam line directs the steam to the main turbine causing it to turn the turbine generator, which produces electricity. The unused steam is exhausted to the condenser where it is condensed into water. The resulting water is pumped out of the condenser with a series of pumps, reheated, and pumped back to the steam generator. The reactors core contains fuel assemblies which are cooled by water, which is force-circulated by electrically powered pumps. Emergency cooling water is supplied by other pumps, which can be powered by onsite diesel generators. Other safety systems, such as the containment cooling system, also need power.
 |
| © U.S. Nuclear Regulatory Commission |
Containment: According to the U.S. Nuclear Regulatory Commission, the containment type for both units is dry, ambient pressure. 1
_________________________________________
1Dry, Ambient Pressure: a reactor containment design whose safety has been evaluated on the basis of having a dry air atmosphere at ambient pressure (0 psig) prior to the onset of a loss of coolant accident or steam pipe break. The containment design (concrete and steel tendons) must be able to take the full thermal and pressure stresses associated with the rapid energy release (steam) from a major pipe break.
Sources for Data in Table: Capacity, for purposes of this report, is the net summer capability as reported in Energy Information Administration (EIA) Form EIA-860, "Annual Electric Generator Report." Capacity Factor is a percentage calculation in which the maximum possible generation (based on net summer capability) is divided into the actual generation then multiplied by 100. Generation is the net electricity output reported by plant owners on Form EIA-906, “Power Plant Report.” Type of Unit: All U.S. commercial reactors currently in operation are one of two types: BWR (boiling water reactor) or PWR (pressurized light water reactor). The type, on-line date, and the license expiration date are published annually in Information Digest by the U.S. Nuclear Regulatory Commission.