Provided by the NOAA Arctic
Research Office
Intro | Leg1
| Leg2 | Cruise
Report | Station Log | Photos
RUSCALA
Distribution of Methane in the Water Column and Bottom Sediments of the Bering Strait and Chukchi Sea.
Alexander Savvichev1,
Igor Rusanov 1& Kathleen Crane2
1 Institute of Microbiology, Russian
Academy of Sciences
2 Arctic Research Office, National Oceanic and
Atmospheric Administration
 One
anticipated consequence of a warming climate in the Arctic Region is the enhanced
release of gaseous methane from the subjacent permafrost. High methane concentration
in the water column and/or sediments may also be indicative of both the nearby
presence of gas deposits or microbial activity in the environment.
Because methane is an important indicator of climate change, the RUSALCA
expedition measured methane levels in both the water column and sediments.
One
anticipated consequence of a warming climate in the Arctic Region is the enhanced
release of gaseous methane from the subjacent permafrost. High methane concentration
in the water column and/or sediments may also be indicative of both the nearby
presence of gas deposits or microbial activity in the environment.
Because methane is an important indicator of climate change, the RUSALCA
expedition measured methane levels in both the water column and sediments.
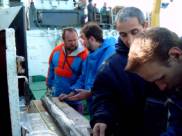
To carry out the methane analysis, water samples were extracted from the Woods Hole rosette system’s bottles and 2-cm3 sub-sections of wet sediments taken from bottom grabs and cores, were placed into a glass vial, 30 cm3 in volume. The sediment was flooded with 1 M KOH solution, leaving 3 cm3 of the bottle volume free and covered by Balch rubber stopper (a headspace technique adapted by Egorov and Ivanov, 1998). After the water and gas phases mixed establishing phase equilibrium, a syringe for chromatographic analysis collected 0.25 ml of the headspace gas. For this purpose, a Chrom-5 with a flame ionization detector was used.
 |
|
Figure 1. Methane concentration in water, depth
40-50 m, ul/l
|
In the water column of the Bering Strait and
southern Chukchi Sea, the contents of methane varied from 0.14 to 0.43 µl/l
(Table. 1). The methane content in the surface layer of the water column was
minimal and corresponded to СН4 partial pressure in
the atmosphere above. The greatest amount of methane was detected in bottom
water of St. 24 and 25 (on the transect from the Chukotka Peninsula and Cape
Lisburne in Alaska) (Figure 1). Methane was also measured in the northwestern
Chukchi Sea along the Herald Canyon. Methane concentrations in this region exceeded
concentrations in the water column of the Bering Strait, rising to 0.92 –
1.14 µl СН4/l at the northern station 89-R
at a depth of 40 m. Samples were
not taken outside the Herald Canyon, so it is not known if this is a localized
event confined to the fault-bounded “canyon” or is part of a much larger regional
release of methane.
Bottom sediment samples from grabs and cores were analyzed north of the Bering Strait. The data show that the values of methane in Western Chukchi Seafloor vary from 5.5-to 420-µl СН4/dm3, varying by location and depth. Sediments from the southern stations of the Chukchi Sea were characterized by rather low methane content (up to 40 µl СН4/dm3)(Figure 2)
 |
|
Figure 2. Methane concentration in surface sediment,
ul/dm3
|
 |
|
Figure 3. Methane concentration in sediment, 40 cm
deep, ul/dm3
|
The highest concentrations of sedimentary methane
were detected from the northern Herald Canyon (at a core depth of
The
methane concentrations in both the sediments and water column of the Chukchi
Sea exceed the values of observed water column and sediment methane concentration
in the Barents and Kara Seas and fall within the range of methane concentrations
measured in the Black and White Seas (Table 3).
The
microbial activity data from the Bering Strait and the Chukchi Sea will be
processed in the laboratory. When these
data are available, we will be able to more clearly determine the provenance of
the elevated methane in the Chukchi Sea.
Table 1.List of water
samples where methane was measured (1-
station number, 2 - depth m, 3 - concentration of methane [CH4], µl/l
|
|
N |
Depth, m |
[CH4] |
|
|
1 |
2 |
3 |
|
|
07-R |
1 |
0,17 |
|
|
|
20 |
0,20 |
|
|
|
50 |
0,22 |
|
|
08-R |
1 |
0,20 |
|
|
|
20 |
0,19 |
|
|
|
40 |
0,20 |
|
|
11-R |
1 |
0,29 |
|
|
|
5 |
0,29 |
|
|
|
9 |
0,29 |
|
|
|
20 |
0,29 |
|
|
|
30 |
0,29 |
|
|
|
40 |
0,29 |
|
|
14-R |
1 |
0,14 |
|
|
|
8 |
0,27 |
|
|
|
30 |
0,27 |
|
|
|
48 |
0,29 |
|
|
15-R |
1 |
0,26 |
|
|
|
10 |
0,22 |
|
|
|
15 |
0,20 |
|
|
|
20 |
0,24 |
|
|
|
35 |
0,26 |
|
|
|
45 |
0,26 |
|
|
20-R |
1 |
0,22 |
|
|
|
10 |
0,24 |
|
|
|
22 |
0,29 |
|
|
|
35 |
0,29 |
|
|
|
50 |
0,29 |
|
|
21-R |
1 |
0,17 |
|
|
|
10 |
0,19 |
|
|
|
15 |
0,19 |
|
|
|
20 |
0,22 |
|
|
|
35 |
0,24 |
|
|
|
50 |
0,24 |
|
|
22-R |
1 |
0,17 |
|
|
|
5 |
0,17 |
|
|
|
15 |
0,19 |
|
|
|
25 |
0,24 |
|
|
|
30 |
0,27 |
|
|
|
40 |
0,31 |
|
|
|
50 |
0,29 |
|
|
24-R |
1 |
0,20 |
|
|
|
6 |
0,17 |
|
|
|
10 |
0,17 |
|
|
|
15 |
0,20 |
|
|
|
20 |
0,30 |
|
|
|
25 |
0,34 |
|
|
|
30 |
0,37 |
|
|
|
40 |
0,37 |
|
|
|
50 |
0,35 |
|
|
25-R |
1 |
0,20 |
|
|
|
10 |
0,29 |
|
|
|
15 |
0,29 |
|
|
|
20 |
0,31 |
|
|
|
35 |
0,41 |
|
|
|
50 |
0,43 |
|
|
106-R |
1 |
0,26 |
|
|
|
6 |
0,29 |
|
|
|
10 |
0,36 |
|
|
|
20 |
0,37 |
|
|
|
24 |
0,36 |
|
|
|
25 |
0,34 |
|
|
|
35 |
0,48 |
|
|
|
45 |
0,48 |
|
|
|
50 |
0,46 |
|
|
|
60 |
0,46 |
|
|
|
66 |
0,43 |
|
|
44-R |
1 |
0,26 |
|
|
|
25 |
0,41 |
|
|
|
50 |
0,34 |
|
|
56-R |
1 |
0,19 |
|
|
|
30 |
0,29 |
|
|
|
50 |
0,26 |
|
|
58-R |
1 |
0,21 |
|
|
|
30 |
0,31 |
|
|
50 |
0,29 |
|
|
60-R |
1 |
0,19 |
|
|
|
20 |
0,34 |
|
|
|
30 |
0,41 |
|
|
|
64 |
0,41 |
|
|
|
90 |
0,37 |
|
|
61-R |
1 |
0,20 |
|
|
|
30 |
0,43 |
|
|
|
80 |
0,37 |
|
|
62-R |
1 |
0,21 |
|
|
|
40 |
0,37 |
|
|
|
62 |
0,37 |
|
|
64-R |
1 |
0,24 |
|
|
|
30 |
0,34 |
|
|
|
50 |
0,46 |
|
|
67-R |
1 |
0,22 |
|
|
|
20 |
0,50 |
|
|
|
36 |
0,39 |
|
|
70-R |
1 |
0,20 |
|
|
|
30 |
0,51 |
|
|
|
54 |
0,41 |
|
|
71-R |
1 |
0,32 |
|
|
|
33 |
0,43 |
|
|
|
57 |
0,56 |
|
|
74-R |
1 |
0,24 |
|
|
|
23 |
0,46 |
|
|
|
69 |
0,43 |
|
|
75-R |
1 |
0,29 |
|
|
|
24 |
0,41 |
|
|
|
73 |
0,37 |
|
|
80-R |
1 |
0,26 |
|
|
|
24 |
0,43 |
|
|
|
49 |
0,43 |
|
|
81-R |
1 |
0,26 |
|
|
|
17 |
0,41 |
|
|
|
32 |
0,34 |
|
|
|
58 |
0,36 |
|
|
82-R |
1 |
0,33 |
|
|
|
21 |
0,34 |
|
|
|
78 |
0,41 |
|
|
83-R |
1 |
0,26 |
|
|
|
22 |
0,37 |
|
|
|
80 |
0,56 |
|
|
85-R |
1 |
0,41 |
|
|
|
23 |
0,31 |
|
|
|
98 |
0,41 |
|
|
86-R |
1 |
0,41 |
|
|
|
19 |
0,39 |
|
|
|
82 |
0,46 |
|
|
87-R |
1 |
0,39 |
|
|
|
16 |
0,37 |
|
|
|
72 |
0,54 |
|
|
88-R |
1 |
0,36 |
|
|
|
25 |
0,46 |
|
|
|
72 |
0,77 |
|
|
89-R |
1 |
0,41 |
|
|
|
6 |
0,39 |
|
|
|
10 |
0,37 |
|
|
|
14 |
0,32 |
|
|
|
22 |
0,34 |
|
|
|
25 |
0,37 |
|
|
|
30 |
0,48 |
|
|
|
40 |
0,92 |
|
|
|
50 |
1,14 |
|
|
|
60 |
1,02 |
|
|
|
70 |
1,00 |
|
|
85B-R |
1 |
0,41 |
|
|
|
30 |
0,46 |
|
|
|
101 |
0,43 |
|
Table 2. Methane concentration in sediments. Station number, depth in core (C), Grab (G), cm. µl/dm3
|
11-G |
0 – 3 |
5,5 |
|
||
|
15-G |
0 – 3 |
16,6 |
|||
|
15-С |
3 – 5 |
26,9 |
|||
|
|
9 – 10 |
14,7 |
|||
|
|
19 – 20 |
15,4 |
|||
|
|
29 – 30 |
14,3 |
|||
|
|
39 – 40 |
36,8 |
|||
|
|
|
|
|||
|
|
54 – 55 |
14,3 |
|||
|
|
64 – 65 |
39,8 |
|||
|
17-G |
0 – 5 |
16,1 |
|||
|
18-G |
0 – 5 |
14,9 |
|||
|
20-G |
0 – 5 |
23,5 |
|||
|
22-G |
0 – 5 |
12,9 |
|||
|
22-C |
4 – 5 |
14,2 |
|||
|
|
9 – 10 |
13,8 |
|||
|
|
19 – 20 |
11,0 |
|||
|
|
29 – 30 |
10,5 |
|||
|
|
39 – 40 |
12,4 |
|||
|
|
44 – 45 |
11,5 |
|||
|
|
59 – 60 |
10,3 |
|||
|
|
79 – 80 |
14,3 |
|||
|
|
99 – 100 |
39,6 |
|||
|
|
119 – 120 |
15,2 |
|||
|
|
134 – 135 |
36,1 |
|||
|
24-G |
0 – 7 |
13,8 |
|||
|
25-G |
0 – 3 |
19,8 |
|||
|
106-G |
0 – 3 |
23,5 |
|||
|
106-C |
3 – 5 |
23,0 |
|||
|
|
9 – 10 |
13,8 |
|||
|
|
19 – 20 |
18,9 |
|||
|
|
29 – 30 |
19,3 |
|||
|
|
39 – 40 |
25,8 |
|||
|
|
49 – 50 |
27,1 |
|||
|
|
59 – 60 |
32,7 |
|||
|
|
79 – 80 |
50,6 |
|||
|
|
99 – 100 |
87,4 |
|||
|
|
119 – 120 |
78,2 |
|||
|
|
144 – 145 |
85,0 |
|||
|
|
159 – 160 |
112,7 |
|||
|
|
169 – 170 |
144,9 |
|||
|
|
189 – 190 |
149,5 |
|||
|
85B-G |
0 – 5 |
14,9 |
|||
|
85B-C |
5 – 6 |
21,6 |
|||
|
|
9 – 10 |
345,0 |
|||
|
|
14 – 15 |
391,0 |
|||
|
|
19 – 20 |
368 |
|||
|
|
29 – 30 |
368 |
|||
|
|
39 – 40 |
403 |
|||
|
|
49 – 50 |
368 |
|||
|
|
59 – 60 |
341 |
|||
|
|
69 – 70 |
334 |
|||
|
|
79 – 80 |
338 |
|||
|
|
89 – 90 |
336 |
|||
|
|
99 – 100 |
363 |
|||
|
|
104-105 |
419 |
|||