Skip Navigation Linksweather.gov
NOAA logo - Click to go to the NOAA homepage National Weather Service   NWS logo - Click to go to the NWS homepage
Lower Mississippi River Forecast Center
Local forecast by
"City, St" or zip code
  
Rivers & Hydrology
Precip & Weather
Climate & History
Additional Info
About The LMRFC
Home :
LMRFC Quick Briefing

Current River Conditions - Flood Category Map of Highest Forecast River Stage
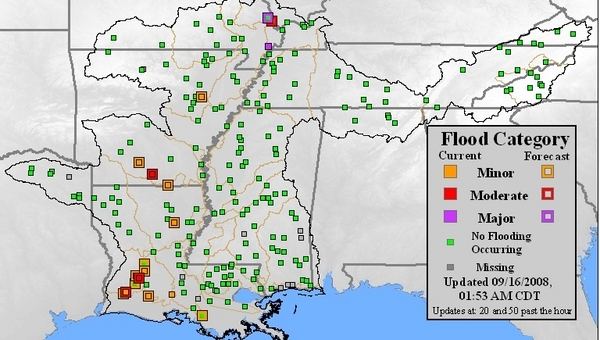
Amite/Comite River Basins Atchafalaya River Basin Big Black River Basin Black River Basin St. Francis River Basin Pascagoula and Gulf Drainage River Basins Pearl River Basins Calcasieu River Basins Red River and Bayou Badcau/Dorcheat Basins French Broad River Basin East Tennessee and SW Virginia River Basins Lower Ouachita River Basin Central Tenn and North Alabama River Basins Lower Mississippi River Upper Ouachita River Basin West Tennessee River Basins White River Basin Yazoo River Basin
The map above updates at :20 and :50 past the hour. Click on the map to obtain detailed river forecast information.
LMRFC River Flood Summary - Updated Updated 09/16/2008 07:20AM Central Daylight Time
Number in Flood Number in Flood and Forecasted to Reach Flood
Minor
10
Moderate
2
Major
2
Total
14
Minor
11
Moderate
4
Major
1
Total
16
Total Number of Forecast Points: 222
Percentage(%) In Flood: 6.3 Percentage(%) In Flood and Forecasted in Flood: 7.2
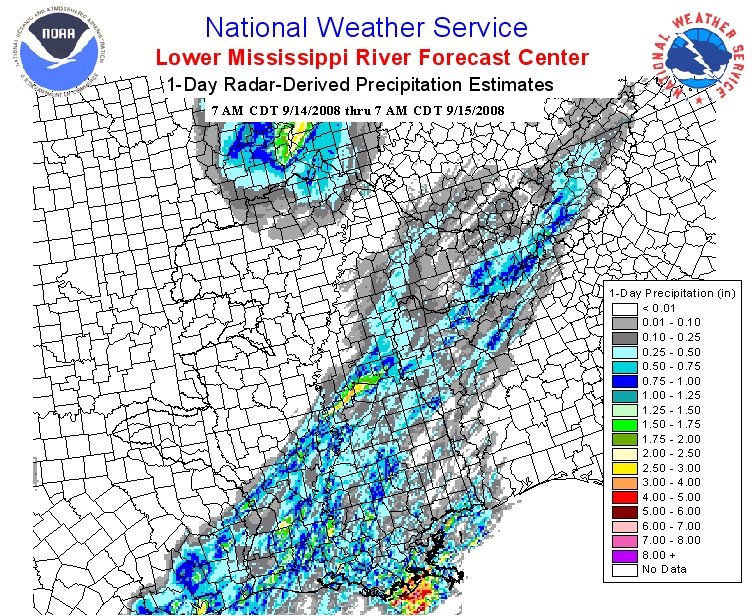
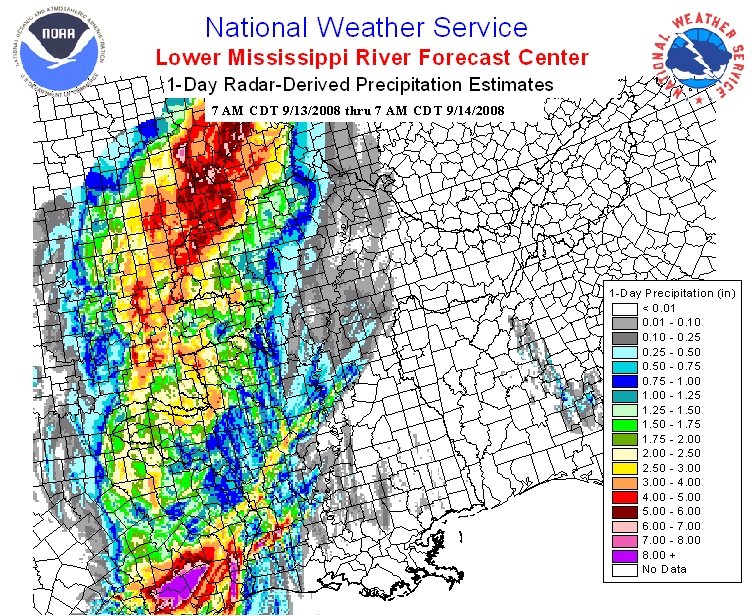
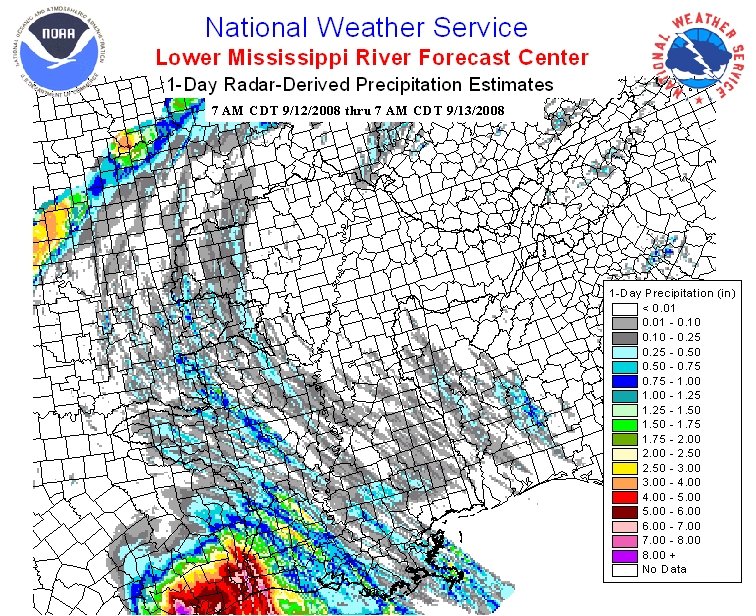
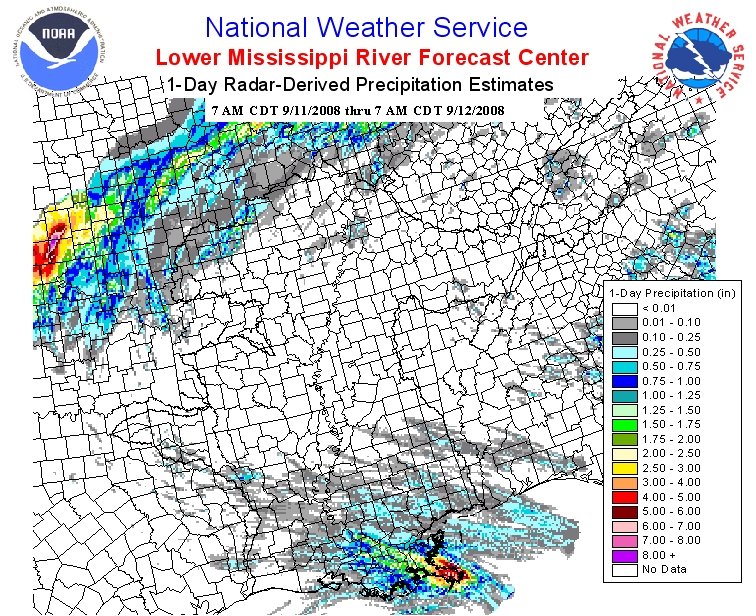
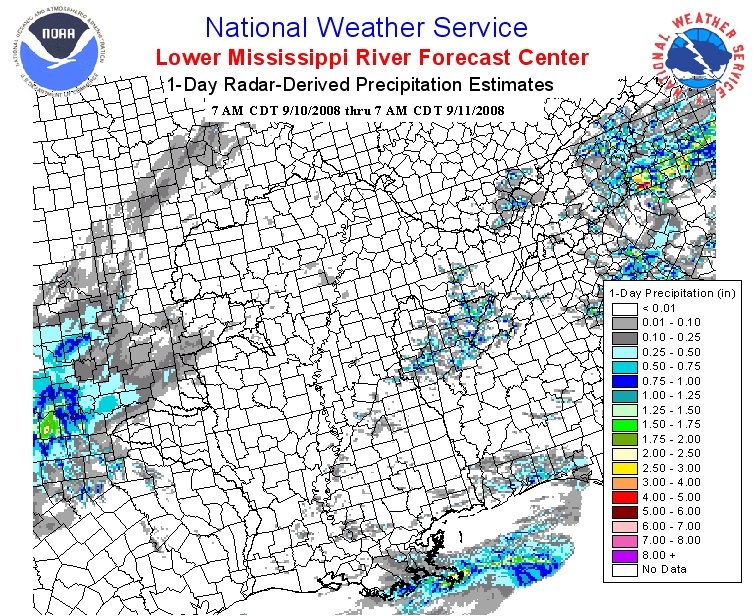
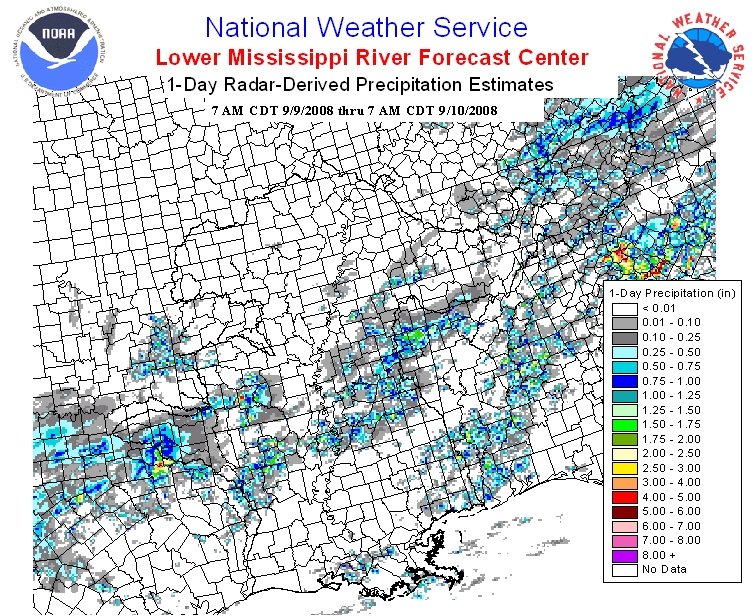
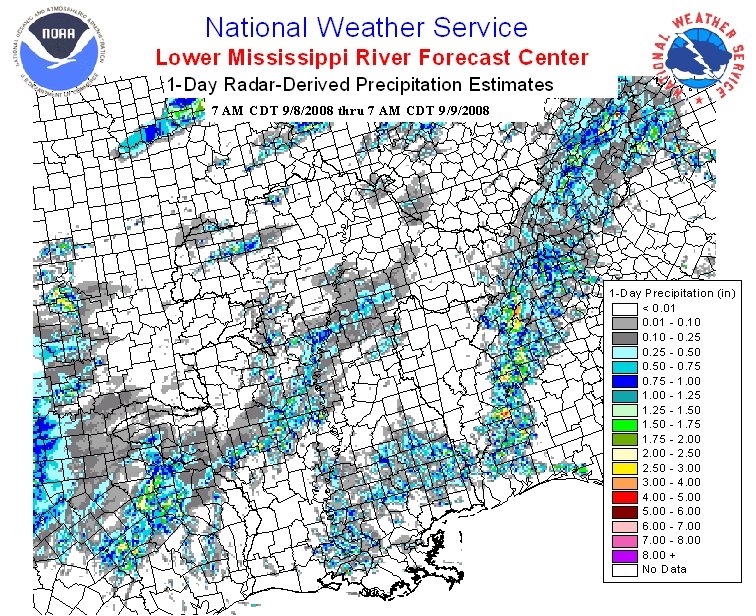
 
Current Precipitation Estimates
Multi-Sensor Precipitation Estimates (MPE)
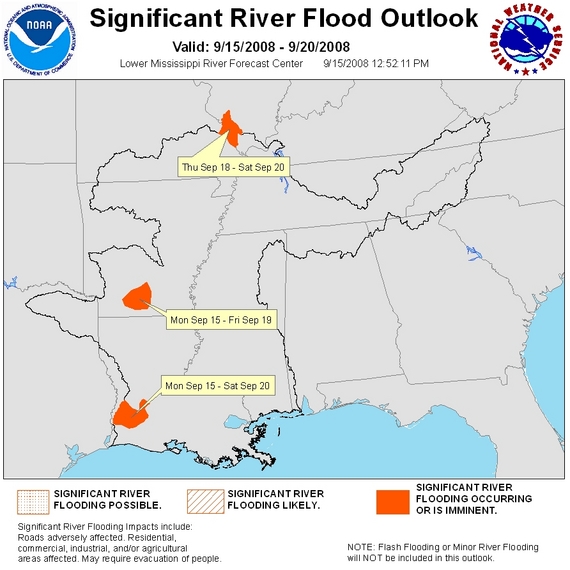
Future Precipitation
Quantitative Precipitation Forecast (QPF)
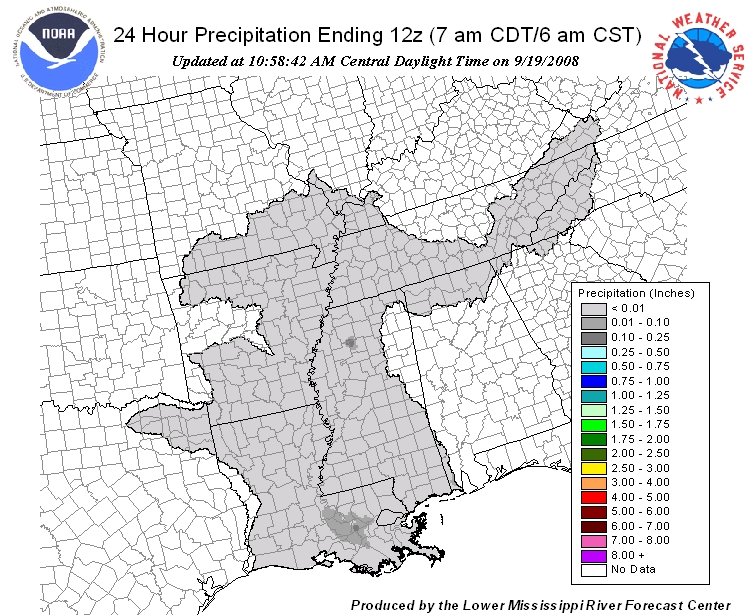
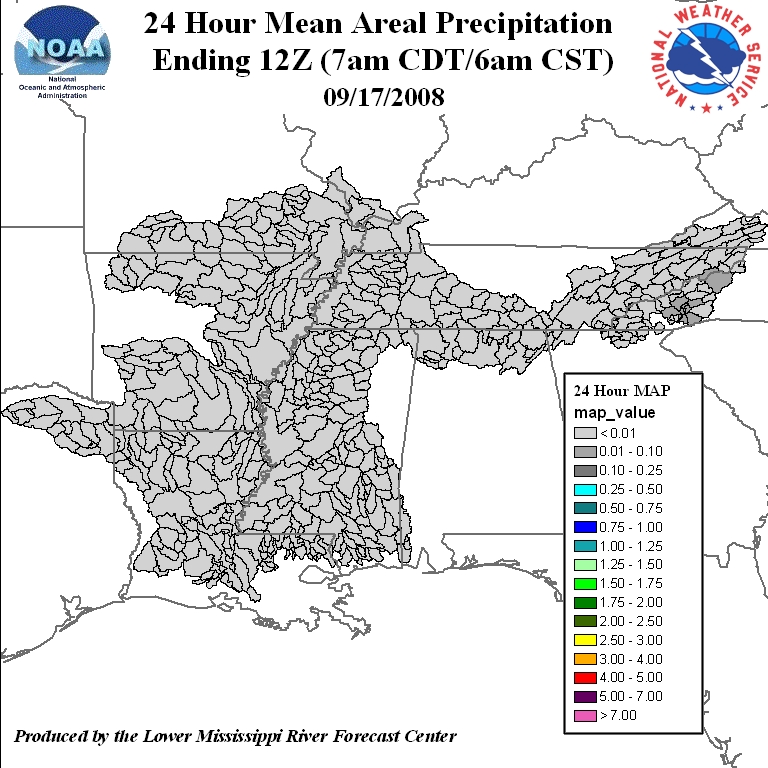
Latest
1 Hour Radar-Derived Precipitation Estimates Ending 10z
Last
Past 3 hours
Last
Past 6 hours
Last
Past 12 hours
Last
Past 24 hours
Since
Since 12Z
 
*Latest Hourly MPE Data*
00Z QPF Images Issued at
Mon Sep 15, 2008 at 07:21 PM
In the table below are links to the latest QPF graphics for the 00Z 24 hour creation time.
12 hour QPF is utilized for river forecasts

Latest 00Z 12 hour QPF starting Sep 16 at 00Z

Latest 00Z 24 hour QPF starting Sep 16 at 00Z

Latest 00Z 48 hour QPF starting Sep 16 at 00Z

Latest 00Z 72 hour QPF starting Sep 16 at 00Z
1st 6 hour period from 00Z
(Sep 16 00Z-06Z)
2nd 6 hour period from 00Z
(Sep 16 06Z-12Z)
3rd 6 hour period from 00Z
(Sep 16 12Z-18Z)
4th 6 hour period from 00Z
(Sep 16 18Z-00Z)
 
Past Precipitation Conditions
Twenty-Four Hour Precipitation ending at 12Z
MPE Data Gage Only Data Mean Areal Precip Data

MPE Data for Monday, September 15 2008
Archives
- Sunday, September 14 2008
- Saturday, September 13 2008
- Friday, September 12 2008
- Thursday, September 11 2008
- Wednesday, September 10 2008
- Tuesday, September 09 2008

Gage Data for Monday, September 15 2008
Archives
- Sunday, September 14 2008
- Saturday, September 13 2008
- Friday, September 12 2008
- Thursday, September 11 2008
- Wednesday, September 10 2008
- Tuesday, September 09 2008

Mean Areal Precipitation Data for Monday, September 15, 2008
Archives
- Sunday, September 14, 2008
- Saturday, September 13, 2008
- Friday, September 12, 2008
- Thursday, September 11, 2008
- Wednesday, September 10, 2008
- Tuesday, September 09, 2008

2, 3, 5, 7 Day Precipitation Totals for Mon, Sep 15 2008 at 12z (6am CST/7am CDT)...
2 Day Total 3 Day Total 5 Day Total 7 Day Total

Click for Image

Click for Image

Click for Image

Click for Image
Click for earlier MPE totals

Flood Potential Map
The LMRFC issues 72 hours of quantitative precipitation forecasts (QPF) throughout the year. For our routine river forecasts, only 12 hours of QPF is normally used. Under certain conditions and based on specific requests by our users, we will utilize 24 hours of QPF in them. A full 72 hours of QPF is used as input to our river models to produce local Significant River Flood Outlooks and National Significant River Flood Outlooks. Therefore, the daily Significant River Flood Outlook does not account for a full 5 days of QPF covering the LMRFC river forecast area.  

5-Day QPF for the United States can be found at http://www.hpc.ncep.noaa.gov/qpf/day1-5.shtml.