By Rebecca L. Johnson, SAIC, contractor to the U.S. Geological Survey
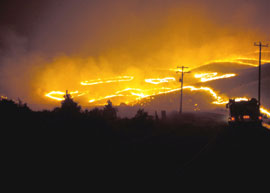
Photo by BLM-Idaho.
The USGS-USDA Monitoring Trends in Burn Severity project is mapping and analyzing the destructive impact of major U.S.wildfires from 1984 to 2010. The project is part of a Wildland Fire Leadership Council strategy to monitor the effectiveness of the National Fire Plan and the Healthy Forests Initiative.
Start with soaring summertime temperatures. Add a profusion
of parched landscapes. Season liberally with violent storms. And you have the
perfect recipe for potentially disastrous wildland fires.
Jeff Eidenshink at the U.S. Geological Survey’s Center for Earth Resources Observation and Science knows that recipe well. But while most of us
merely wonder or worry about where the next fire will strike, Eidenshink is
part of a scientific effort to assess the occurrence and effects of wildland
fires in the United States
over time. The Monitoring Trends in Burn Severity project is a six-year
collaboration between USGS and the USDA Forest Service to map and analyze the
destructive impact, or burn severity, of large wildfires over a 26-year period.
(The MTBS project defines large fires as those that affect more than 1,000 acres in the western United States
or 500 acres in the East.) This project is part of the Wildland Fire
Leadership Council’s overall strategy to monitor the effectiveness of the
National Fire Plan and the Healthy Forests Restoration Act.
In the past, consistent geospatial information on the effects
of large U.S.
wildfires was nonexistent. Researchers and land managers had no scientifically
sound baseline for burn severity, no clear and comprehensive data set to
identify trends in the frequency of wildland fires or the shifts in the
post-fire characteristics of burned lands.
But the MTBS project is changing that. For the next several
years, the project will be creating an invaluable data legacy of wildland fires
and their impacts across the nation. “Burn severity maps and analyses will help
answer many fundamental questions about wildland fires, including how fires
relate to possible climate change,” Eidenshink says.
Eidenshink and his colleagues
at EROS and the Forest Service’s Remote Sensing Applications Center are
developing data on U.S. wildfires by using a powerful mathematical tool, the
“differenced Normalized Burn Ratio algorithm.” The methodology to map burn
severity was developed by colleagues from USGS and the National Park Service.
The group has begun mapping the burn severity of the thousands of major U.S.
wildland fires from 1984 to 2010 and is carrying out the project in two
concurrent time phases: historic and current.
They are mapping by region fires from 1984 to 2003 (historic fires). At the same time, they are mapping fires across the country from 2004 to 2010 (current fires). Mapping is now underway for historic fires in the Pacific Northwest and
California. Mapping for current fires from 2004 culminated this past spring. During 2004, 347 major wildland fires raged
across 7,781,049 acres nationwide.
This extraordinary project contains an essential ingredient: Landsat images. These readily available, low-cost images provide the longest
consistent record of relatively high spatial and spectral resolution data for
mapping burn severity. In fact by employing Normalized Burn Ratio algorithms, the project's computer programs can automatically extract a great deal of fundamental burn-severity
information from Landsat images. However, creating burn-severity maps, requires the skills of highly trained analysts. These specialists interpret the raw data
in light of their own experience with fire behavior and its effects in a given
ecological setting. It is a time-consuming process.
“Once an analyst has the appropriate pre- and post-fire imagery
in hand,” says Eidenshink, “a single assessment can take several hours,
depending upon the size of the fire and the complexity of the interplay of land-cover
and burn-severity variations.”
The mapping team will have to invest an enormous amount of
time and effort to analyze all of the major wildfires from 1984 to
2010. But the 26-year span of the
project is critical. Severe periodic droughts, increased fuel loads, and a
higher frequency of uncharacteristic fires since 2000 have made it essential
for trend analyses to span a significant period of time. These lengthier analyses will
help the mapping team better account for variability in factors potentially
affecting fire severity, including climate.
The maps and analyses from the MTBS project are accessible
to anyone at http://svinetfc4.fs.fed.us/mtbs/, but local,
state and national researchers and land and resource managers are the site’s
primary audience. Online project information will help this group to evaluate trends in burn severity and to develop and assess the effectiveness of their land-management decisions. It will also provide them with an essential
baseline from which they can monitor the recovery and health of fire-affected
landscapes over time — a recipe for success.
To learn how scientists create burn-severity maps, go to:
http://eros.usgs.gov/images/mtbs_process.jpg


 Print Version
 E-mail This Article
