
|
|
||
Marine Ecosystem - Bering Sea |
||||||||||||||||||||
|
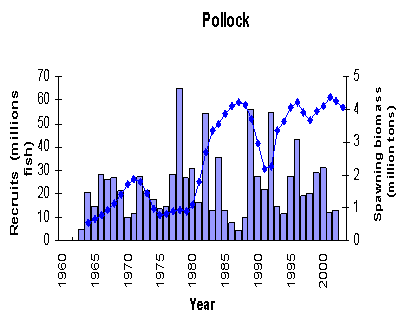
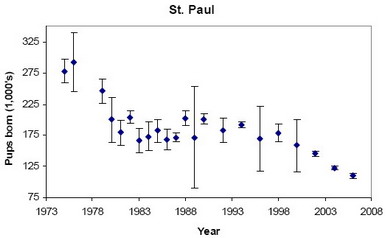
Overview | Bering Sea | Barents Sea | Greenland The Bering Sea in the western Arctic is showing indications that Arctic species which require the presence of sea ice are being replaced by sub-Arctic species that don't require sea ice. An indicator of this shift is that summer water temperatures of the southeast Bering Sea are nearly 2 degrees C warmer in 2001-2003 than 1995-1997 (figure below left), and that ice in this region is leaving earlier (figure below right). Pollock are currently a major economic resource for the Bering Sea. Lack of sea ice tends to favor pollock, which has had a high biomass for the last decade, at the expense of bottom-living fish and crab. The biomass for pollock in millions of tons (diamonds) for Bering Sea, and the number of new fish added each year (recruitment) are shown in in the middle figure below. Marine mammals are also major consumers of fish and other species in the Bering Sea ecosystem and may also have been impacted by climate shifts. The number of new fur sea pups added to the population on St. Paul Island (in the Pribilof Islands) (bottom figure), shows a decrease after the 1970s and another more recent decrease after 1998. Although it is difficult to assign direct causes to the declines, there was a climate shift in the North Pacific Ocean in 1977, and there has been sustained warming in the 2000s.
Find more information (references and websites): |
||||||||||||||||||||
| Awards About the Arctic Change Indicator website | http://www.arctic.noaa.gov/detect arctic.webmaster@noaa.gov NOAA Arctic website, http://www.arctic.noaa.gov Privacy Policy | Disclaimer |