Cindy had a long track across the Atlantic with no direct impact on land.
a. Synoptic History
The origin of Cindy can be traced back to a tropical wave that crossed the
west coast of Africa early on the 18th, accompanied by 4.5 mb 24-hour
surface pressure falls and a 50-knot 700 mb jet as seen in Dakar, Senegal
rawinsonde data and Shortly after entering the eastern tropical Atlantic,
deep convection began to gradually become better organized. By the evening
of the 18th, satellite imagery and ship reports indicated that
shower and thunderstorm activity became more consolidated near the center of
a broad circulation. It is estimated that a tropical depression formed from
this system around 0000 UTC on 19 August, centered about 250 n mi
east-southeast of the Cape Verde Islands, as shown in the post-storm "best
track" (Table 1, Figure 1).
Persistent 20 to 30 knot easterly vertical shear, as shown in analyses from
the University of Wisconsin Cooperative Institute for Meteorological
Satellite Studies, prevented the system from becoming significantly better
organization during the next 36 hours. By the afternoon of the
20th, the shear relaxed and the center of the depression became
more co-located with the deep convection. The system is estimated to have
become Tropical Storm Cindy by 1800 UTC 20 August, in agreement with Dvorak
satellite classifications from the Tropical Analysis and Forecast Branch
(TAFB), the Satellite Analysis Branch (SAB), and the U.S. Air Force Weather
Agency. Cindy continued to become better organized on the 21st as
banding features developed and a CDO formed over the center. Cindy reached
hurricane strength at 0000 UTC 22 August, about 390 n mi west of the Cape
Verde Islands. Further intensification was arrested as easterly shear became
more pronounced. Cindy weakened to a tropical storm at 1800 UTC 22 August.
By the afternoon of the 25th, the easterly shear slackened and
Cindy re-strengthened to hurricane intensity at 0000 UTC 26 August, while
located about 1100 n mi southeast of Bermuda. Cindy continued to intensify
during the next several days as banding features became more prominent and
the upper tropospheric outflow improved. A ragged eye first appeared in
visible satellite imagery on the morning of the 27th, and by that
afternoon a 25 n mi diameter banding-type eye became evident. The hurricane
continued to strengthen and reached an estimated peak intensity of 120 knots
at 1200 UTC 28 August, while centered about 375 miles east-southeast of
Bermuda.
On 29 and 30 August, Cindy began to weaken in response to increasing
westerly, then southwesterly shear. The overall cloud pattern gradually
degenerated and the eye became indiscernible, the cloud tops warmed, and the
deep convection became displaced north, and eventually mainly east, of the
center.
For its first five days Cindy had a motion toward the west-northwest at 6 to
12 knots. The motion was northwestward at 12 to 18 knots from late on the
24th through the 26th under the influence of the
subtropical anticyclone over the north Atlantic. On the 27th,
a mid-to upper-level low located southwest of Cindy helped steer the hurricane
more to the west. By late on the 27th, the tropical cyclone began
to decelerate when an upper-level trough along 55W-60W began to pull Cindy
on a more northwesterly, then northerly heading. Cindy reached its
westernmost longitude, about 58.5W, on the afternoon of the 28th. On 29
August, the system turned northeast and it began to accelerate late on the
30th. Cindy's closest approach to Bermuda, about 325 n mi,
occurred at 0600 UTC 29 August.
Cindy was downgraded to a tropical storm at 0600 UTC 31 August as the system
continued to accelerate northeastward into progressively cooler waters. By
that afternoon, Cindy became indistinct when it merged with a large
extratropical cyclone over the north Atlantic about 850 n mi west of the
Azores.
b. Meteorological Statistics
Figure 2 depicts the curves of minimum central sea-level
pressure and maximum one-minute average "surface" (10 meters above ground
level) wind speed, respectively, as a function of time. Also plotted are
the observations on which the curves are based, consisting of
Dvorak-technique estimates from TAFB, SAB, and the U.S. Air Force Weather
Agency (AFWA) using satellite imagery.
Satellite-based intensity estimates on 28 August are the main basis for the
peak intensity estimate of 120 knots in the best track; the objective-based
Dvorak intensity estimate is the basis for the minimum central pressure of
942 mb at 1200 UTC 28 August. Ship reports of tropical storm force or
greater wind speeds associated with Cindy are listed in
Table 2.
Figure 3 is a series of SSM/I (A) and TRMM microwave
images produced by the Naval Research Laboratory that depict Cindy 24 hours
prior to peak intensity (A), near peak intensity (B), and 24 hours (C) and
48 hours (D) after the peak. The eye diameter in (B) is about 30 n mi. The
small circulation in the bottom center of (B) is Tropical Depression Emily.
Figure 4 is a sequence of surface wind estimates from
NASA's Quick Scatterometer (QuikSCAT) for Cindy. This figure shows the
surface wind field of Cindy about 24 hours prior to peak intensity (A), near
peak intensity (B), after recurvature (C), and after absorption by an
extratropical cyclone over the north Atlantic (D). Although these data are
still experimental and subject to calibration, they shows both the size and
evolution of the wind field from near peak intensity to recurvature and the
resulting circulation asymmetry.
c. Casualty and Damage Statistics
No reports of casualties or damage due to Cindy have been received at the
National Hurricane Center.
d. Forecast and Warning Critique
The official forecast errors for Cindy were generally low relative to the
most recent ten-year averages. The average 12-, 24-, 36-, 48-, and 72-hr
official forecast errors and associated number of cases (in parenthesis)
were 42 (42), 81 (40), 118 (38), 154 (36), and 226 (32) n mi, respectively.
While the official forecast errors were below the most recent ten-year
averages, many of the objective techniques were even better
(Table 3). In
particular, LBAR, BAMD, NGPI, and the UKMI all had substantially lower track
errors than the official forecast (with the exception of the 12 h UKMI).
These models did especially well with the recurvature portion of the
hurricane.
An inspection of several NHC forecasts showed that the 72 h forecasts issued
between 0000 and 1800 UTC 27 August and valid from 30/00 UTC to 30/18 UTC
indicated an acceleration from 12 to 19 knots. During this period, Cindy
moved on a general northeast heading at 8 to 10 knots and did not begin to
accelerate until 0000 UTC 31 August.
The average absolute official intensity forecasts errors ranged from 5 to 10
knots between 12 and 36 hours and 12 to 16 knots from 48 to 72 hours. These
errors are 20% to 30% below the most recent ten-year averages. The
Statistical Hurricane Intensity Prediction Scheme (SHIPS) did equally well.
The official forecasts, however, under-estimated the peak intensity by 25 to
35 knots in the 24- to 72-h time periods.
No watches or warnings were necessary for Cindy.

Figure 1.
Best track positions for Hurricane Cindy, 19-31 August 1999.

Figure 2a.
Best track minimum central pressure curve for Hurricane Cindy, 19-31 August
1999.

Figure 2a.
Best track maximum sustained 1-minute 10 meter wind speed curve for
Hurricane Cindy, 19-31 August 1999.

Figure 3.
Sequence of SSM/I (A) and TRMM microwave images of Hurricane Cindy
(A) 24 hours prior to peak intensity, (B) near peak intensity, (C) 24 hours
after peak intensity, and (D) 48 hours after peak intensity. (The small
circulation in the bottom center of (B) is Tropical Depression Emily).
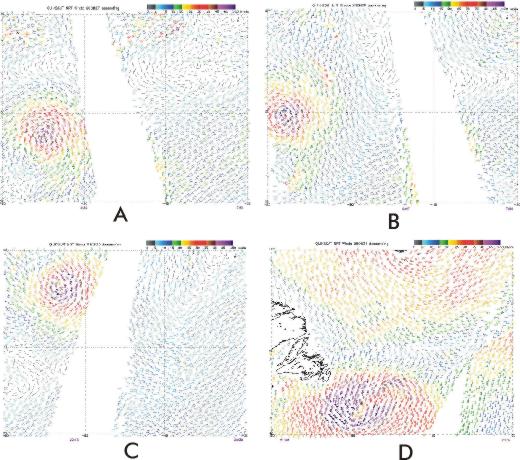
Figure 4.
Surface wind estimates from NASA's Quick Scatterometer (QuikSCAT) of
Hurricane Cindy (A) about 24 hours prior to peak intensity, (B) near peak
intensity, (C) after recurvature, and (D) after absorption by an
extratropical cyclone over the north Atlantic. (The date for each QuikSCAT
image is on the top of each image while the time of the pass is denoted on
the bottom).
Table 1.
Preliminary Best Track - Hurricane Cindy, 19-31 August, 1999.
Date/Time
(UTC) | Position |
Pressure
(mb) |
Wind Speed
(kt) | Stage |
| Lat. (°N) | Lon. (°W) |
| 19/0000 | 13.5 | 18.9 | 1003 | 30 | Tropical Depression |
| 19/0600 | 13.8 | 20.3 | 1003 | 30 | " |
| 19/1200 | 13.9 | 21.5 | 1003 | 30 | " |
| 19/1800 | 13.8 | 22.5 | 1003 | 30 | " |
| 20/0000 | 13.7 | 23.4 | 1002 | 30 | " |
| 20/0600 | 13.6 | 24.3 | 1002 | 30 | " |
| 20/1200 | 13.5 | 25.4 | 1002 | 30 | " |
| 20/1800 | 13.6 | 26.6 | 1001 | 35 | Tropical Storm |
| 21/0000 | 13.6 | 27.7 | 1000 | 40 | " |
| 21/0600 | 13.8 | 28.8 | 997 | 50 | " |
| 21/1200 | 13.9 | 29.7 | 994 | 55 | " |
| 21/1800 | 14.1 | 30.8 | 990 | 60 | " |
| 22/0000 | 14.2 | 31.7 | 987 | 65 | Hurricane |
| 22/0600 | 14.4 | 32.3 | 987 | 65 | " |
| 22/1200 | 14.5 | 32.7 | 987 | 65 | " |
| 22/1800 | 14.6 | 33.1 | 990 | 60 | Tropical Storm |
| 23/0000 | 14.9 | 33.9 | 997 | 50 | " |
| 23/0600 | 15.3 | 34.9 | 997 | 50 | " |
| 23/1200 | 15.7 | 35.9 | 997 | 50 | " |
| 23/1800 | 16.1 | 36.9 | 997 | 50 | " |
| 24/0000 | 16.6 | 38.0 | 997 | 50 | " |
| 24/0600 | 16.9 | 39.2 | 997 | 50 | " |
| 24/1200 | 17.2 | 40.6 | 997 | 50 | " |
| 24/1800 | 17.5 | 42.2 | 997 | 50 | " |
| 25/0000 | 17.8 | 43.6 | 994 | 55 | " |
| 25/0600 | 18.4 | 44.8 | 994 | 55 | " |
| 25/1200 | 19.3 | 45.9 | 994 | 55 | " |
| 25/1800 | 20.4 | 47.1 | 990 | 60 | " |
| 26/0000 | 21.7 | 48.2 | 987 | 65 | Hurricane |
| 26/0600 | 22.9 | 49.5 | 987 | 65 | " |
| 26/1200 | 24.2 | 50.8 | 987 | 65 | " |
| 26/1800 | 25.4 | 52.0 | 984 | 70 | " |
| 27/0000 | 26.4 | 53.1 | 978 | 80 | " |
| 27/0600 | 27.2 | 54.3 | 978 | 80 | " |
| 27/1200 | 27.8 | 55.4 | 970 | 90 | " |
| 27/1800 | 28.3 | 56.2 | 970 | 90 | " |
| 28/0000 | 28.7 | 56.9 | 961 | 100 | " |
| 28/0600 | 29.3 | 57.5 | 948 | 115 | " |
| 28/1200 | 30.1 | 58.0 | 942 | 120 | " |
| 28/1800 | 30.8 | 58.5 | 943 | 120 | " |
| 29/0000 | 31.5 | 58.4 | 944 | 120 | " |
| 29/0600 | 32.3 | 58.4 | 948 | 115 | " |
| 29/1200 | 33.1 | 58.2 | 961 | 100 | " |
| 29/1800 | 33.8 | 57.4 | 965 | 95 | " |
| 30/0000 | 34.3 | 56.3 | 970 | 90 | " |
| 30/0600 | 34.7 | 55.5 | 970 | 90 | " |
| 30/1200 | 35.3 | 54.9 | 978 | 80 | " |
| 30/1800 | 36.1 | 54.2 | 978 | 80 | " |
| 31/0000 | 37.0 | 52.6 | 984 | 70 | " |
| 31/0600 | 38.2 | 50.6 | 990 | 60 | Tropical Storm |
| 31/1200 | 40.4 | 48.2 | 997 | 50 | " |
| 31/1800 | | Absorbed By Extratropical Low |
| |
| 28/1200 | 30.1 | 58.0 | 942 | 120 | minimum pressure |
Table 2.
Hurricane Cindy ship observations of 34-Knot or greater winds, 19 August - 31 August 1999.
| Location |
Pressure
(mb) |
Date/time
(UTC) |
Sustained
wind
(kts) a |
Significant
Wave Ht. (ft) |
| ZCBB9 (26.5N 47.0W) | 1015.2 | 26/0600 | 37 | 13 |
| ELUU6 (26.5N 51.8W) | 1015.1 | 26/1200 | 36 | 16 |
| ELUU6 (26.8N 51.7W) | 1012.4 | 26/1500 | 38 | 16 |
| ELUU6 (26.9N 51.4W) | 1009.7 | 26/1800 | 60 | 23 |
| ELUU6 (27.1N 51.1W) | 1017.7 | 27/0000 | 62 | 30 |
| ELUU6 (27.4N 49.8W) | 1016.7 | 27/0900 | 40 | 16 |
Table 3.
Preliminary track forecast evaluation of Hurricane Cindy -
heterogeneous sample. Errors in nautical miles for tropical storm and
hurricane stages with number of forecasts in parenthesis. Boldface numbers
represent forecasts which were better than the official
forecast.
| Forecast Technique |
Period (hours) |
| CLIP | 52 (42) | 96 (40) | 145 (38) | 194 (36) | 260 (32) |
| GFDI | 44 (34) | 82 (32) | 114 (32) | 151 (32) | 225 (30) |
| GFDL* | 37 (17) | 75 (17) | 113 (16) | 145 (16) | 223 (16) |
| LBAR | 38 (42) | 64 (40) | 102 (38) | 140 (36) | 196 (32) |
| AVNI | 52 (39) | 92 (37) | 133 (34) | 177 (30) | 288 (22) |
| AVNO* | 47 (39) | 91 (36) | 127 (34) | 166 (30) | 249 (22) |
| BAMD | 38 (42) | 69 (40) | 97 (38) | 119 (36) | 204 (32) |
| BAMM | 39 (44) | 72 (44) | 109 (44) | 147 (43) | 243 (39) |
| BAMS | 45 (42) | 83 (40) | 125 (38) | 179 (36) | 303 (32) |
| NGPI | 41 (41) | 76 (39) | 87 (35) | 105 (33) | 153 (27) |
| NGPS* | 45 (21) | 61 (20) | 77 (18) | 96 (17) | 128 (14) |
| UKMI | 49 (40) | 70 (38) | 94 (36) | 103 (34) | 177 (30) |
| UKM* | 41 (21) | 73 (20) | 87 (19) | 106 (18) | 139 (16) |
| A90E | 46 (42) | 77 (40) | 110 (38) | 149 (36) | 224 (32) |
| A98E | 45 (41) | 75 (39) | 107 (38) | 153 (36) | 224 (32) |
| A9UK | 41 (19) | 72 (18) | 95 (17) | 110 (16) | 182 (15) |
| |
| NHC Official | 42 (42) | 81 (40) | 118 (38) | 154 (36) | 226 (32) |
| NHC Official 10-Year Average (1989-1998) | 48 (2005) | 89 (1790) | 128 (1595) | 164 (1410) | 242 (1107) |
*Output from these models was unavailable at time of forecast issuance.
![[NCEP Logo]](graphics/ncep.gif)