Expanding the Reach and Impact of
Consumer e-Health Tools
June 2006

|
Expanding the Reach and Impact of
|
|
|
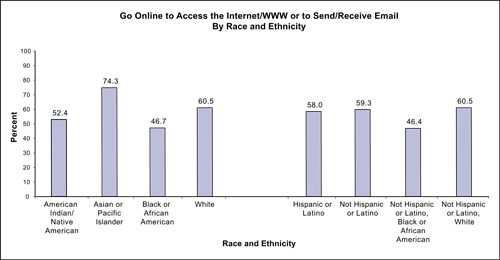
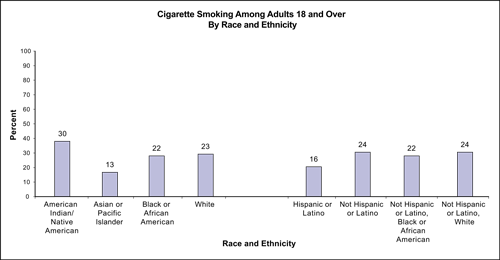
< Back to Appendix 4 (Moderate/Vigorous Physical Activity) Appendix 4. A Comparison of Internet Use and Health Status of Populations That Experience Health Disparities (Part 8)7. Tobacco Use7.1 Race and EthnicityAmerican Indians/Alaska Natives have higher rates of cigarette smoking compared to other racial and ethnic groups (Figure 38) and also have low rates of Internet use, second to Blacks/African Americans (Figure 37). Source: Pew Internet & American
Life Project’s Daily Internet Tracking Survey, Source: CDC Wonder. DATA2010…the
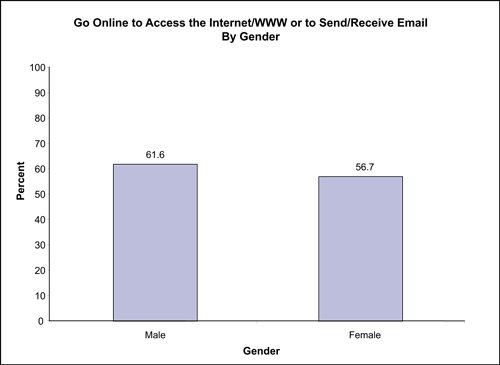
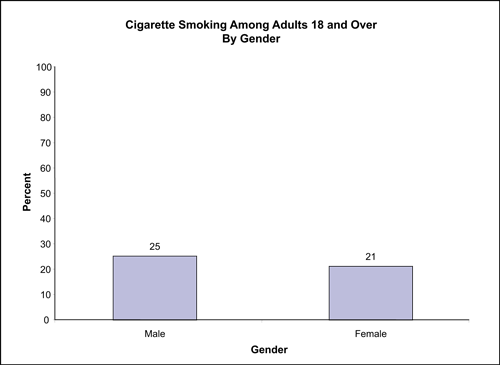
Healthy People 2010 Database. 7.2 GenderLarge differences do not appear to exist between males and females in cigarette smoking (Figure 40). Similarly, differences in Internet use do not appear to differ largely between males and females (Figure 39). Source: Pew Internet & American
Life Project's Daily Internet Tracking Survey, Source: CDC Wonder. DATA2010…the
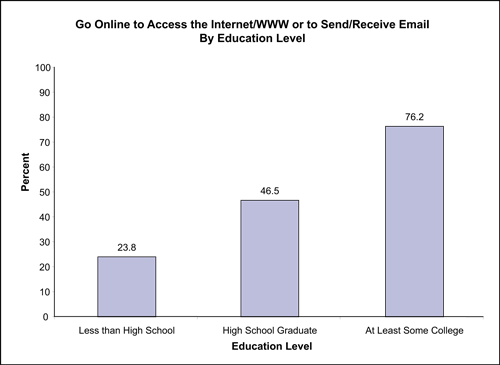
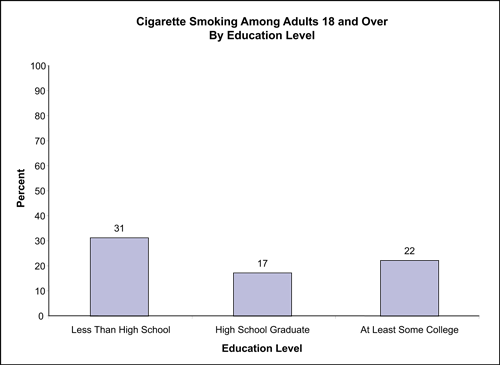
Healthy People 2010 Database. 7.3 Education LevelThose with less than a high school education have the highest level of cigarette smoking (Figure 42), but they have the lowest level of Internet use (Figure 41). Source: Pew Internet & American
Life Project's Daily Internet Tracking Survey, Source: CDC Wonder. DATA2010…the
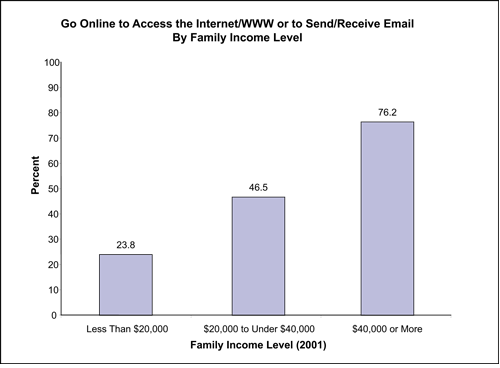
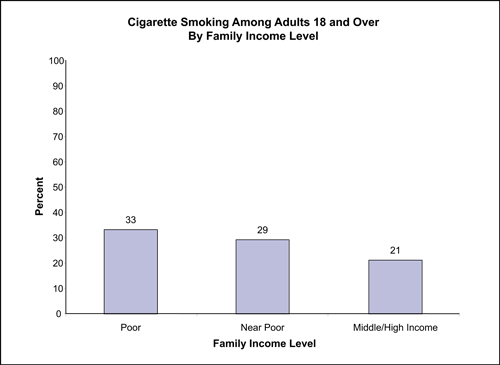
Healthy People 2010 Database. 7.4 Family Income LevelLow-income populations have higher rates of cigarette smoking compared to middle- or high-income populations, yet Internet use is considerably lower for those with lower incomes when compared to those with higher incomes (Figures 43 and 44). Source: Pew Internet & American
Life Project's Daily Internet Tracking Survey, Source: CDC Wonder. DATA2010…the
Healthy People 2010 Database. |
|
| Back to Top | Appendix 4—Data Sources and Methodology > |