|
BJS home page
Contents of Homicide
trends in the U.S.
Previous
Next
|
Homicide
trends in the U.S.
Long term trends and patterns
Homicide
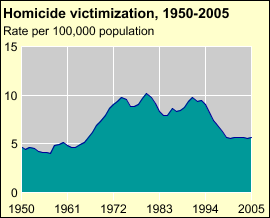
rates recently declined to levels last seen in the late 1960's
- The homicide rate nearly doubled from the mid 1960's to the late 1970's.
- In 1980, it peaked at 10.2 per 100,000 population and subsequently
fell off to 7.9 per 100,000 in 1984.
- It rose again in the late 1980's and early 1990's to another peak
in 1991 of 9.8 per 100,000.
- From 1992 to 2000, the rate declined sharply. Since then, the rate
has been stable.
To
view data, click on the chart.
-
 [D]
[D]
Source: FBI, Uniform Crime Reports, 1950-2005
See also Key Facts at a Glance chart on Homicide
victimization rates since 1900 based on data from the Vital
Statistics of the United States.
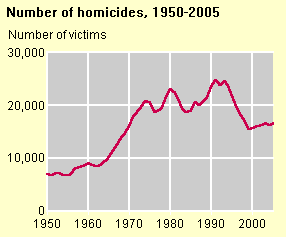
After falling rapidly in the mid to late 1990's,
the number of homicides began increasing in 1999 but remain at levels
below those experienced in the early 1970's
To view data, click on the
chart.
-
 [D] [D]
Source: FBI, Uniform Crime Reports, 1950-2005
The demographic characteristics of homicide victims and offenders
differ from the general population
Based on data for the years 1976-2005 -
- Blacks are disproportionately represented as both homicide victims
and offenders. The victimization rates for blacks were 6 times higher
than those for whites. The offending rates for blacks were more than 7 times higher
the rates for whites.
- Males represent 77% of homicide victims and nearly 90%
of offenders. The victimization rates for males were 3 times higher
than the rates for females. The offending rates for males were 8 times
higher than the rates for females.
- Approximately one-third of murder victims and almost half the offenders
are under the age of 25. For both victims and offenders, the rate per
100,000 peaks in the 18-24 year-old age group.
Victims and Offenders by Demographic Group, 1976-2005
| |
|
Percent of - |
Rate per 100,000
population |
| |
|
Victims |
Offenders |
Population |
Victims |
Offenders |
| |
Total |
100.0% |
100.0% |
100.0% |
7.8 |
|
8.7 |
|
| Age |
|
|
|
|
|
|
|
| |
Under 14 |
4.8% |
.5% |
20.5% |
1.8 |
|
.2 |
|
| |
14-17 |
5.0% |
10.4% |
6.1% |
6.4 |
|
14.9 |
|
| |
18-24 |
23.9% |
36.6% |
10.8% |
17.0 |
|
29.3 |
|
| |
25-34 |
28.8% |
28.4% |
15.7% |
14.2 |
|
15.8 |
|
| |
35-49 |
22.8% |
17.3% |
20.5% |
8.6 |
|
7.3 |
|
| |
50-64 |
9.3% |
5.1% |
14.2% |
5.1 |
|
3.1 |
|
| |
65+ |
5.3% |
1.7% |
12.3% |
3.4 |
|
1.2 |
|
| Gender |
|
|
|
|
|
|
|
| |
Male |
76.5% |
88.8% |
48.8% |
12.3 |
|
15.8 |
|
| |
Female |
23.5% |
11.2% |
51.2% |
3.6 |
|
1.9 |
|
| Race |
|
|
|
|
|
|
|
| |
White |
50.9% |
45.8% |
83.7% |
4.7 |
|
4.8 |
|
| |
Black |
46.9% |
52.2% |
12.3% |
29.6 |
|
36.9 |
|
| |
Other |
2.1% |
2.0% |
4.0% |
4.1 |
|
4.4 |
|
Source: FBI, Supplementary Homicide Reports, 1976-2005.
See also Additional Information about the Data.
Note: The victims of the 9/11/01 terrorist attacks are not included in this analysis.
|