
If you are using
Navigator 4.x
or
Internet Explorer 4.x
or
Omni Web 4.x
, this site will not render
correctly!
Vis > gallery > climate diagnostics > Climate Diagnostics Visualizations
Climate Diagnostics Visualizations
Ocean Observation and Modeling (LEVITUS) | |
|
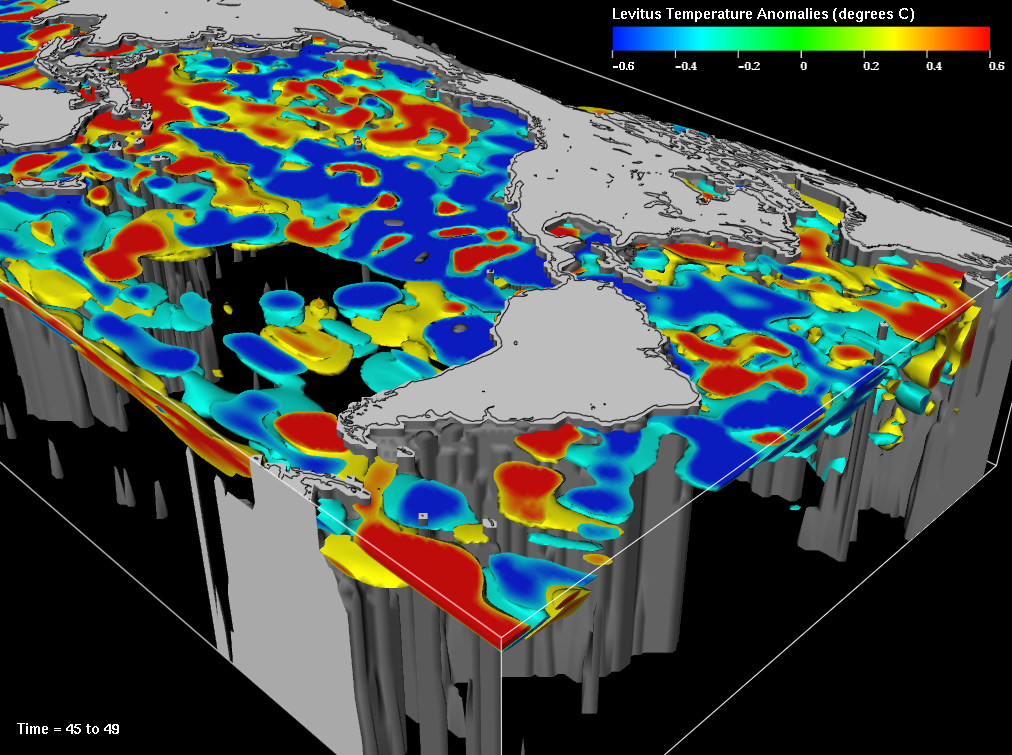
The LEVITUS data set (left) represents objectively analyzed fields of major ocean parameters, such as temperature, at the annual, seasonal, and monthly time scales. Researchers here at GFDL/NOAA rely on such empirical results as a basis for theoretical development. |
Upper Tropospheric Relative Humidity | |

|
This figure depicts the relative humidity found in our atmosphere, as observed by satellites part of the GOES project. The gray and white regions are cloud structures. |
| More Information | |
| Research Group: | Climate Diagnostics |