Residents of Rural Areas
About 1 in 5 Americans lives in a nonmetropolitan area.61 Compared with their urban counterparts, rural residents are more likely to be elderly, poor,62 and in fair or poor health, and to have chronic conditions.61 Rural residents are less likely to receive recommended preventive services and report, on average, fewer visits to health care providers.63
Although 20% of Americans live in rural areas,xiv only 9% of physicians in America practice in those settings.64 Nurse practitioners, nurse midwives, and physician assistants also help to deliver care. Multiple programs and services help to deliver needed services in rural areas, such as the National Health Service Corps Scholarship Program, Indian Health Service, State offices of rural health, rural health clinics, and community health centers. Cost-based Medicare reimbursement incentives are also available for rural health clinics, critical access hospitals, sole community hospitals, and Medicare-dependent hospitals in Health Professional Shortage areas.
Many rural residents depend on small rural hospitals for their care. There are approximately 2,000 rural hospitals throughout the country,65 1,500 of which have 50 or fewer beds. Most of these hospitals are critical access hospitals that have fewer than 25 beds. Rural hospitals largely provide primary care and chronic disease management. They face unique challenges due to their size and case-mix. During the 1980s, many were forced to close because of financia1 losses;66 however, during the past few years, finances of small rural hospitals have improved.
Transportation needs are pronounced among rural residents, who face longer distances to reach health care delivery sites. Of the nearly 1,000 "frontier counties"xv in the Nation, most have limited health care services and many do not have any.67
Many measures of relevance to residents of rural areas are tracked in the NHDR. Findings presented here highlight four quality measures and one access measure of particular importance to residents of rural areas:
| Component of health care need |
Measure |
| Prevention |
Prenatal care/maternal health |
| Treatment |
Inpatient deaths from heart attack |
| Management |
Receipt of recommended services for diabetes |
| Timeliness |
Care for illness or injury as soon as wanted |
| Access to care |
Health insurance |
xiv Many terms are used to refer to the continuum of geographic areas. For Census 2000, the Census Bureau's classification of "rural" consists of all territory, population, and housing units located outside of urban areas and urban clusters. The Census Bureau classified as "urban" all territory, population, and housing units located within (a) core census block groups or blocks that have a population density of at least 1,000 people per square mile and (b) surrounding census blocks that have an overall density of at least 500 people per square mile.
xv " Frontier counties" have a population density of less than 7 persons per square mile; residents travel long distances for care.
In previous NHDRs, detailed geographic typologies were applied to two AHRQ databases—the Medical Expenditure Panel Survey (MEPS) and the Healthcare Cost and Utilization Project (HCUP)—to define variations in health care quality and access for a range of rural and urban locations. This year, in addition to presenting data from MEPS and HCUP, the NHDR presents a measure from the National Vital Statistics System—Natality (NVSS-Natality). Federal definitions of micropolitan and noncore statistical areas (not metropolitan or micropolitan areas) published in June 2003 are used.68 In addition, Urban Influence Codes are used to subdivide metropolitan areas into large and small metropolitan areas. Thus, categories used in this section of the NHDR may be defined as follows:
- Large metropolitan statistical area—Metropolitan area of 1 million or more inhabitants.
- Small metropolitan statistical area—Metropolitan area of fewer than 1 million inhabitants.
- Micropolitan statistical area—Urban area of at least 10,000 but fewer than 50,000 inhabitants.
- Noncore statistical area—Not metropolitan or micropolitan.
Urban-rural contrasts for measures from MEPS and HCUP compare residents of rural statistical areas (including both micropolitan and noncore statistical areas) with residents of urban statistical areas (including both large and small metropolitan statistical areas). For the measure from the NVSS-Natality, residents of rural statistical areas (including both micropolitan and noncore statistical areas) are compared with residents from more specific urban statistical areas (including large central metropolitan, large fringe metropolitan, medium metropolitan, and small metropolitan). Sample sizes are often too small to provide reliable estimates for noncore statistical areas, limiting the ability to assess disparities among residents of these areas.
Return to Contents
Quality of Health Care
Prevention: Prenatal Care/Maternal Health
Childbirth and reproductive care are the most common reasons for women of childbearing age to use health care, and childbirth is the most common reason for hospital admission.69 It is recommended that women begin receiving prenatal care in the first trimester of pregnancy.
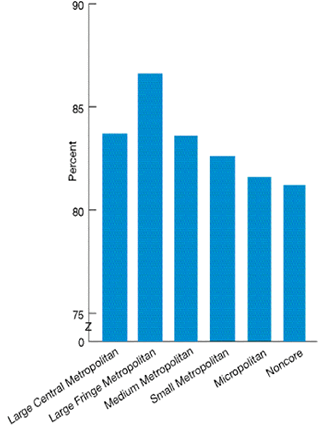
Figure 4.55. Pregnant women with prenatal care in the first trimester, by geographic location, 2004
Source: Centers for Disease Control and Prevention, National Center for Health Statistics, National Vital Statistics System-Natality, 2004.
Reference population: Women with live births.
Note: Sample sizes were too small to provide estimates by race, ethnicity, income, or education. Large central metropolitan = >1 million and meets one of the following criteria: (1) contains entire population of largest principal city in the metropolitan statistical area, (2) entire population resides in the largest principal city in the metropolitan statistical area, or (3) contains at least 250,000 of the population of any principal city in the metropolitan statistical area; large fringe metropolitan= >1 million but does not qualify as large central; medium metropolitan = counties in a metropolitan statistical area of 250,000-999,999 population; small metropolitan = counties in a metropolitan statistical area of 50,000-249,999 population; micropolitan = urban area >10,000 and <50,000 inhabitants; noncore = not metropolitan or micropolitan.
- In 2004, there were no significant differences observed in the proportion of women who initiated prenatal care in the first trimester (Figure 4.55).
- No metropolitan statistical area, regardless of size, achieved the Healthy People 2010 target of 90% of pregnant women receiving prenatal care in the first trimester.
Treatment: Inpatient Deaths From Heart Attack
Heart disease is the leading cause of death for both men and women in the United States, responsible for over 654,486 deaths in 2004.70 About 1.2 million heart attacks occur each year.71 Data on inpatient hospital deaths for patients who are admitted for a heart attack (acute myocardial infarction, or AMI) are presented. To distinguish the effects of race/ethnicity on the AMI inhospital mortality rate within urban and rural areas, racial/ethnic data are stratified by urban and rural location of patient residence.
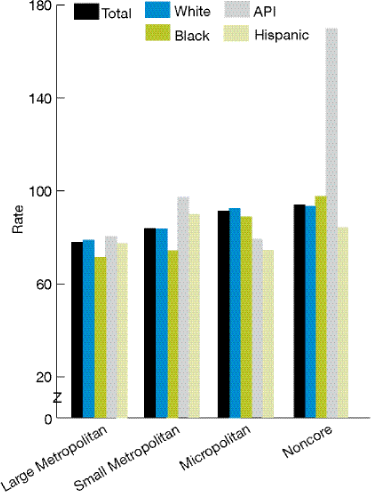
Figure 4.56. Deaths per 1,000 adult admissions with heart attack as principal diagnosis, by race/ethnicity and geographic location, 2004
Key: API = Asian or Pacific Islander.
Source: Agency for Healthcare Research and Quality, Healthcare Cost and Utilization Project State Inpatient Databases (HCUP SID) disparities analysis file, 2004. The HCUP SID disparities analysis file is designed to provide national estimates using weighted records from a sample of hospitals from 23 States that have 64% of the U.S. resident population.
Denominator: Adults age 18 and older hospitalized for heart attack in community hospitals.
Note: White, Black, and API are non-Hispanic groups. Large metropolitan = metropolitan area >1 million inhabitants; small metropolitan= metropolitan area <1 million inhabitants; micropolitan = urban area >10,000 and <50,000 inhabitants; noncore = not metropolitan or micropolitan.
- The overall AMI mortality rate was significantly higher for persons admitted to hospitals in noncore areas (94.1 per 1,000 admissions) than for persons living in large or small metropolitan areas (78.1 per 1,000 and 83.9 per 1,000 admissions, respectively; Figure 4.56).
- The overall rate was also significantly higher for persons admitted to hospitals in micropolitan areas than for persons living in large metropolitan areas (91.5 per 1,000 compared with 78.1 per 1,000 admissions).
- In large metropolitan areas, the AMI mortality rate was lower for Blacks than for Whites (71.5 per 1,000 compared with 79.0 per 1,000).
- In small metropolitan areas, the rate was lower for Blacks (74.4 per 1,000) but higher for APIs (97.4 per 1,000) and Hispanics (90.1 per 1,000) compared with Whites (83.7 per 1,000).
- In micropolitan areas, the rate was lower for APIs (79.4 per 1,000) and for Hispanics (74.5 per 1,000) than for Whites (92.5 per 1,000).
- In noncore areas, the rate was significantly higher for APIs than for Whites (169.9 per 1,000 compared with 93.5 per 1,000).
Management: Receipt of Recommended Services for Diabetes
The NHDR presents a composite measure that tracks receipt of three recommended services for effective management of diabetes: HbA1c testing, eye examination, and foot examination in the past year.
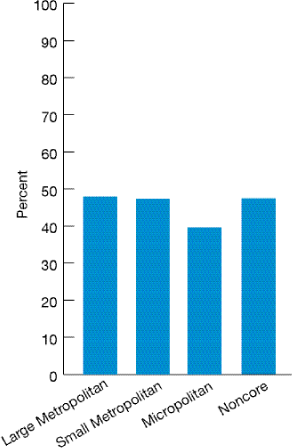
Figure 4.57. Adults age 40 and over with diagnosed diabetes who had three recommended services for diabetes in the past year, by geographic location, 2004
Source: Agency for Healthcare Research and Quality, Medical Expenditure Panel Survey, 2004.
Reference population: Civilian noninstitutionalized population of adults age 40 and over.
Note: Recommended services for diabetes are (1) HbA1c testing, (2) retinal eye examination, and (3) foot examination in past year. Sample sizes were too small to provide estimates by race, ethnicity, income, or education. Large metropolitan = metropolitan area >1 million inhabitants; small metropolitan = metropolitan area <1 million inhabitants; micropolitan= urban area >10,000 and <50,000 inhabitants; noncore = not metropolitan or micropolitan.
- Significant differences for persons from large and small metropolitan, micropolitan, and noncore areas were not observed in the proportion of adults age 40 and over with diabetes who received three recommended services (Figure 4.57).
Timeliness: Care for Illness or Injury as Soon as Wanted
Timely delivery of appropriate care has been shown to improve health care outcomes and reduce health care costs. Furthermore, when patients need or want care, having access to that care improves their health care experience, which may further promote health.
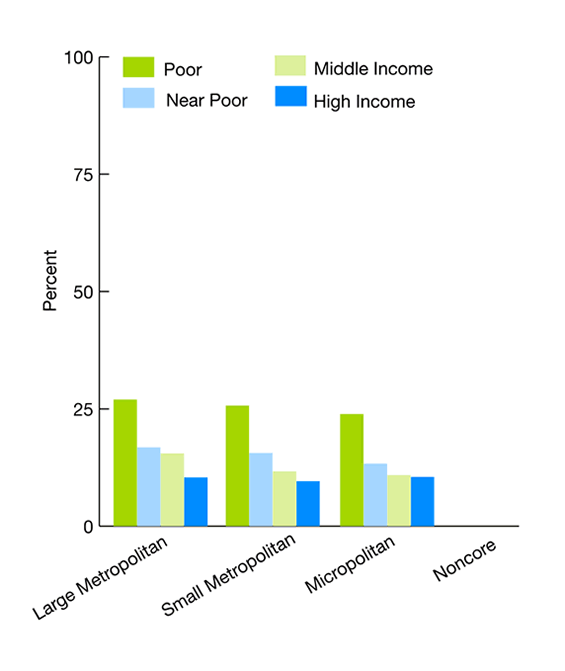
Figure 4.58. Adults who sometimes or never get care for illness or injury as soon as wanted, by income (left) and education (right), stratified by geographic location, 2004
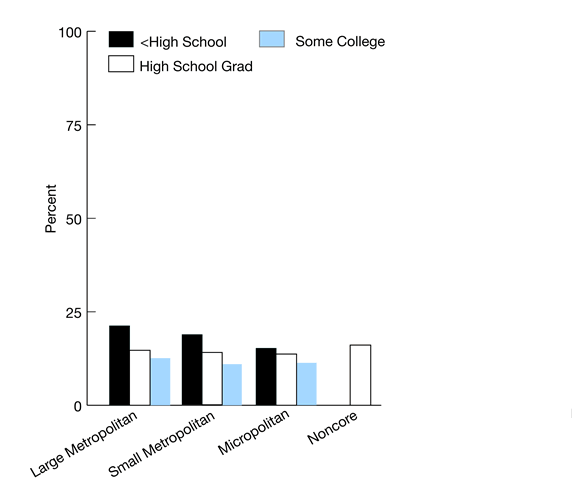
Source: Agency for Healthcare Research and Quality, Medical Expenditure Panel Survey, 2004.
Reference population: Civilian noninstitutionalized population age 18 and over.
Note: Large metropolitan = metropolitan areas >1 million inhabitants; small metropolitan = metropolitan areas <1 million inhabitants; micropolitan = urban area >10,000 and <50,000 inhabitants; noncore = <10,000. Data are not available for income groups in noncore areas.
- There were no significant differences observed in the overall rate of adults who sometimes or never get care for illness or injury as soon as wanted (Figure 4.58).
Return to Contents
Access to Health Care
Health Insurance
Access to health care is a prerequisite to receipt of care, yet many Americans still face barriers to care. Data for prolonged periods of uninsurance (no insurance coverage for a full year) are presented.
Figure 4.59. Adults under age 65 uninsured all year, by race (top left), ethnicity (top right), income (bottom left), and education (bottom right), stratified by geographic location, 2004

Source: Agency for Healthcare Research and Quality, Medical Expenditure Panel Survey, 2004.
Reference population: Civilian noninstitutionalized population age 18 and over.
Note: Large metropolitan = metropolitan area >1 million inhabitants; small metropolitan = metropolitan area <1 million inhabitants; micropolitan = urban area >10,000 and <50,000 inhabitants; noncore-adjacent = not metropolitan or micropolitan. Estimates for noncore-not adjacent areas and for high income persons from noncore-adjacent areas did not meet criteria for statistical reliability and are not reported here.
- There were no significant differences between persons from large metropolitan areas and persons from micropolitan or noncore-adjacent (rural) areas in the overall proportion of adults under age 65 uninsured all year (data not shown; Figure 4.59).
- The overall proportion of adults under age 65 uninsured all year was significantly higher among persons from noncore-adjacent statistical areas (15.4%) compared with persons from small metropolitan areas (12.4%; data not shown). There was no significant difference between persons from micropolitan areas compared with small metropolitan areas.
- In large metropolitan areas, the proportion uninsured was significantly higher for Hispanics compared with non-Hispanic Whites (29.5% compared with 9.6%); for poor (26.7%), near poor (25.2%), and middle income persons (14.6%) compared with high income persons (6.5%); and for persons with less than a high school education compared with persons with some college (33.1% compared with 10.6%; Figure 4.59).
- In small metropolitan areas, the proportion was significantly higher for Hispanics compared with non-Hispanic Whites (26.3% compared with 10.0%); for poor (22.2%), near poor (20.8%), and middle income persons (13.1%) compared with high income persons (4.6%); and for persons with less than a high school education compared with persons with some college (29.7% compared with 8.4%).
- In micropolitan areas, the rate was higher for Blacks compared with Whites (23.6% compared with 13.6%), for Hispanics compared with non-Hispanic Whites (27.1% compared with 12.3%), for poor (23.5%) and near poor persons (25.6%) compared with high income persons (7.9%), and for persons with less than a high school education compared with persons with some college (31.3% compared with 12%).
- In noncore-adjacent areas, the proportion was significantly higher for Hispanics compared with non-Hispanic Whites (36% compared with 13.3%) and for persons with less than a high school education compared with persons with some college (32.4% compared with 13.2%).
Return to Contents
Individuals With Disabilities and Special Health Care Needs
Individuals with disabilities and special health care needs include persons with disabilities; persons who utilize nursing home care, home health care, or end-of-life health care; and children with special heath care needs (CSHCN). Many measures of relevance to individuals with special health care needs are tracked in the NHDR.
In this year's report, data on quality and access are presented for adults with disabilities and for CSHCN. The section on adults with disabilities uses data from the Medical Expenditure Panel Survey (MEPS) and is new for this year's report; the goal for future NHDRs is to include even more information about individuals with disabilities using MEPS and other data sources such as the National Health Interview Survey and Medicare Current Beneficiary Survey, as well as data for children with disabilities. As in previous reports, data on quality and access are presented for CSHCN.
Adults With Disabilities
| Component of health care need |
Measure |
| Prevention |
Counseling obese adults about exercise |
| Safety |
Inappropriate medication use by the elderly |
| Access to care |
Delayed carexvi |
| Children With Special Health Care Needs |
| Component of health care need |
Measure |
| Timeliness |
Care for illness or injury as soon as wanted |
| Patient centeredness |
Poor communication with health providers |
Additionally, findings for persons who utilize nursing home care are presented in the section on nursing home, home health, and hospice care in Chapter 2, Quality of Health Care.
xvi This is a supplemental measure of the NHDR measure set.
Return to Contents
Adults With Disabilities
This year, the NHDR aims to include more information about individuals with disabilities than in previous iterations of the report. In reaching this goal, AHRQ convened a disabilities subgroup of the NHQR/NHDR Interagency Work Group, with the assistance of the Interagency Subcommittee on Disability Statistics (ISDS) of the Interagency Committee on Disability Research. The charge to this group was to advise AHRQ on measures of disabilities from existent data that could track disparities in quality and access to care for individuals with disabilities for the NHDR and that would be comparable across national surveys. For this initial effort, the subgroup focused on measures for the adult population, the population for whom there were the most existing survey data.
Several ways of defining and measuring disability exist. Among the more common approaches are to identify individuals who have problems performing everyday functions such as vision, hearing, communication, self-care, mobility, learning, and behavior; have difficulty with complex activities such as working; or meet the eligibility criteria for important income maintenance or training programs (e.g., SSDI [Social Security Disability Income] or vocational rehabilitation). However, a particular challenge in reporting on racial, ethnic, and socioeconomic differences related to disability is that many data collections do not capture disability and, when collected, do not collect it in the same way.
The International Classification of Functioning, Disability and Health (ICF)72 was adopted by the disabilities subgroup as a model to guide the deliberations. Questions and response categories for three national surveys—the National Health Interview Survey, the Medical Expenditure Panel Survey, and the Medicare Current Beneficiary Survey—were carefully reviewed by the subgroup for consistencies and discrepancies in measurement of the major domains of disabilities in the ICF.
For the 2007 NHDR, AHRQ is using a broad, inclusive measure of disability that is intended to be consistent with statutory definitions of disability, such as the first criterion of the 1990 Americans with Disabilities Act (i.e., having a physical or mental impairment that substantially limits one or more major life activities73, 74) and other Federal program definitions of disability. For the purpose of the NHDR, people with disabilities are those with physical, sensory, and/or mental health conditions that can be associated with a decrease in functioning in such day-to-day activities as bathing, walking, doing everyday chores, and/or engaging in work or social activities.
In displaying the data on disability, paired measures are shown to preserve the qualitative aspects of the data:
- Limitations in basic activities represent problems with mobility and other basic functioning at the person level.
- Limitations in complex activities represent limitations encountered when the person, in interaction with the environment, attempts to participate in community life.
The use of the subgroup's recommendation of these paired measures of basic and complex activity limitations is conceptually similar to the way others have divided disability3, 75 and is consistent with the ICF separation of activities and participation domains.1 These two categories are not mutually exclusive; persons may have limitations both in basic activities and in complex activities. For the purpose of comparisons, data on adults with and without disabilities are presented.
Prevention: Counseling Obese Adults About Exercise
Counseling obese adults about exercise is an important component of effective weight management, particularly for adults with disabilities, because adults with disabilities are more likely to be obese or overweight than other adults. An estimated 37.7% of adults with basic activity limitations and 39.7% of adults with complex activity limitations are obese, compared with 23.8% of adults with neither basic nor complex activity limitations.76 This finding is consistent with other studies.77,78
Figure 4.60. Obese adults who were ever given advice by a doctor or other health professional about exercise, by race/ethnicity, income, education, and activity limitation, 2004

Key: Basic = basic activity limitation (i.e., limitation in mobility or other basic person-level functioning); complex = complex activity limitation (i.e., limitation in ability to participate in community life); neither = neither basic nor complex activity limitations.
Source: Agency for Healthcare Research and Quality, Medical Expenditure Panel Survey, 2004.
Reference population: Adults age 18 and over living in the community.
Note: Whites and Blacks are non-Hispanic groups.
- For the total adult population, obese persons with basic and complex activity limitations were significantly more likely than obese persons with neither limitation to receive advice about exercise. Of obese adults, approximately 73.6% of those with basic activity limitations and 72.8% of those with complex activity limitations received advice about exercise, compared with 55.0% of those with neither limitations (Figure 4.60).
- For each racial, ethnic, income, and education group, obese adults with basic and complex activity limitations were significantly more likely than obese adults with neither limitation to receive advice about exercise.
- Differences between obese adults with basic activity limitations and those with complex activity limitations in the proportion receiving advice about exercise were not significant, regardless of racial/ethnic, income, or education group.
- Among obese persons with neither basic nor complex activity limitation, receiving advice about exercise was significantly less likely for Blacks and Hispanics than Whites; poor, near poor, and middle income persons than high income persons; and persons with a high school education or less than persons with some college.
- Among obese adults with basic activity limitations, poor and near poor persons were significantly less likely than high income persons, and persons with less than a high school education were significantly less likely than those with some college, to receive advice about exercise.
- Among obese persons with complex activity limitations, poor persons were significantly less likely than high income persons, and persons with less than a high school education were significantly less likely than those with some college, to receive advice about exercise.
Safety: Inappropriate Medication Use by the Elderly
Appropriate use of medications is particularly important for the elderly, since the elderly have higher use of medications than others.79 The NHDR tracks the percentage of adults age 65 and over who had at least 1 prescription from a list of 33 medications considered usually inappropriate for this age group.
Figure 4.61. Adults age 65 and over with inappropriate medication use, by race, ethnicity, education, and activity limitation, 2004
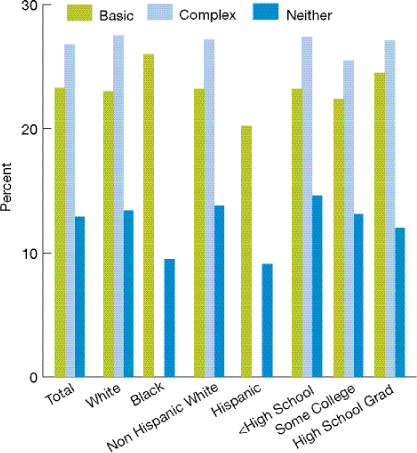
Key: Basic = basic activity limitation (i.e., limitation in mobility or other basic person-level functioning); complex = complex activity limitation (i.e., limitation in ability to participate in community life); neither = neither basic nor complex activity limitation.
Source: Agency for Healthcare Research and Quality, Medical Expenditure Panel Survey, 2004.
Reference population: Adults age 65 and over living in the community.
Note: Data for Blacks and Hispanics with complex activity limitations do not meet the criteria for statistical reliability, data quality, or confidentiality and therefore are not shown.
- For all adults age 65 and over, persons with basic and complex activity limitations were significantly more likely than persons with neither limitation to have used 1 of 33 inappropriate medications (Figure 4.61).
- Among adults age 65 and over, approximately 23.3% of those with basic activity limitations and 26.8% of those with complex activity limitations have used 1 of 33 inappropriate medications, compared with 12.9% of those with neither.
- For both Whites and Blacks, for non-Hispanic Whites and Hispanics, and for each education group, adults age 65 and over with basic and complex activity limitations were significantly more likely than persons with neither limitation to have used 1 of the 33 inappropriate medications.
- Among adults age 65 and over with neither basic nor complex activity limitations, non-Hispanic Whites were significantly more likely than Hispanics to have used 1 of the 33 inappropriate medications.
- Significant differences in inappropriate medication use were not observed for any of the other racial, ethnic, or education comparisons by specific activity limitation group (neither, basic, complex).
Access to Health Care: Delayed Care
Timely delivery of appropriate care has been shown to improve health care outcomes and reduce health care costs. Delayed health care can lead to diagnosis at a more advanced disease stage and reduce opportunities for optimal treatment.
Figure 4.62. Adults who were unable to receive or delayed in receiving needed medical care, dental care, or prescription medications, by race, ethnicity, income, education, and activity limitation, 2004
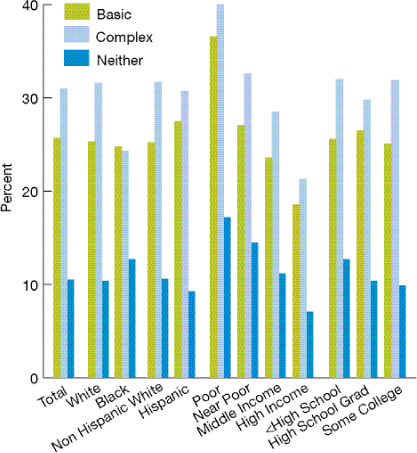
Key: Basic activity limitation (i.e., limitation in mobility or other basic person-level functioning); complex = complex activity limitation (i.e., limitation in ability to participate in community life); neither = neither basic nor complex activity limitation.
Source: Agency for Healthcare Research and Quality, Medical Expenditure Panel Survey, 2004.
Reference population: Adults age 18 or over living in the community.
- For the total population, adults with basic and complex activity limitations were significantly more likely than persons with neither limitation to be unable to receive care or to delay receiving care. Of adults, 25.7% of those with basic activity limitations and 31.0% of those with complex activity limitations were unable to receive or delayed in receiving needed medical care, dental care, or prescription medicines, compared with 10.5% of those with neither limitation (Figure 4.62).
- For each racial, ethnic, income, and education group, adults with basic and complex activity limitations were significantly more likely than adults with neither limitation to be unable to receive or to delay receiving needed care.
- For Whites, adults with less than a high school education, and adults with some college, those with complex activity limitations were significantly more likely than their counterparts with basic activity limitations to not receive or to delay receiving care.
- Among adults with neither basic nor complex activity limitations, not receiving or delaying receiving care was significantly more likely for Blacks than Whites; poor, near poor, and middle income persons than high income persons; and persons with less than a high school education than those with some college.
- Among adults with basic activity limitations, poor, near poor, and middle income persons were significantly more likely than high income persons to be unable to receive or to delay receiving needed care.
- Among adults with complex activity limitations, Whites were significantly more likely than Blacks to be unable to receive or to delay receiving needed care; and poor, near poor, and middle income persons were more likely than high income persons to be unable to receive or to delay receiving needed care.
Return to Contents
Children With Special Health Care Needs
Addressing questions on access to and quality of care for children with chronic conditions is difficult due to the low prevalence of most conditions in children.80 According to the Medical Expenditure Panel Survey, in 2004, approximately 13.8 million children were identified as having a special health care need—i.e., a specific chronic condition with a functional limitation or other consequence. Among the most highly prevalent chronic conditions of childhood in 2005 were asthma (13% of children under age 18), upper respiratory allergies (12% of children under 18), learning disabilities (7% of children ages 3-17), and attention-deficit hyperactivity disorder (7% of children ages 3-17).81 Other conditions that may affect children with special health care needs include depression, spina bifida, hemophilia, HIV infection, cystic fibrosis, and metabolic disorders.82
By definition, children with special health care needs (CSHCN) are children who require more medical care because they are less healthy. As a result of requiring more medical care, CSHCN have higher medical expenses, on average, than other children.80, 83, 84 For more than 1 in 5 CSHCN, costs of care caused financial problems for their families.85 In addition to financial burdens, families of CSHCN spend considerable time caring for them. An estimated 13.5% of CSHCN had families who spent 11 or more hours per week providing or coordinating care in 2001.85
Having higher health care needs makes CSHCN susceptible to access, cost, quality, and coverage weaknesses in the health care system. Children with chronic conditions are reported by their parents to be less likely than other children to receive the full range of needed health services.86
Timeliness: Care for Illness or Injury as Soon as Wanted
Timely delivery of appropriate care has been shown to improve health care outcomes and reduce health care costs, which may be particularly important for CSHCN.
Figure 4.63. Among children with special health care needs, those who can always get care for illness or injury as soon as wanted, by race (top left), ethnicity (top right), and family income (bottom left), 2002-2004
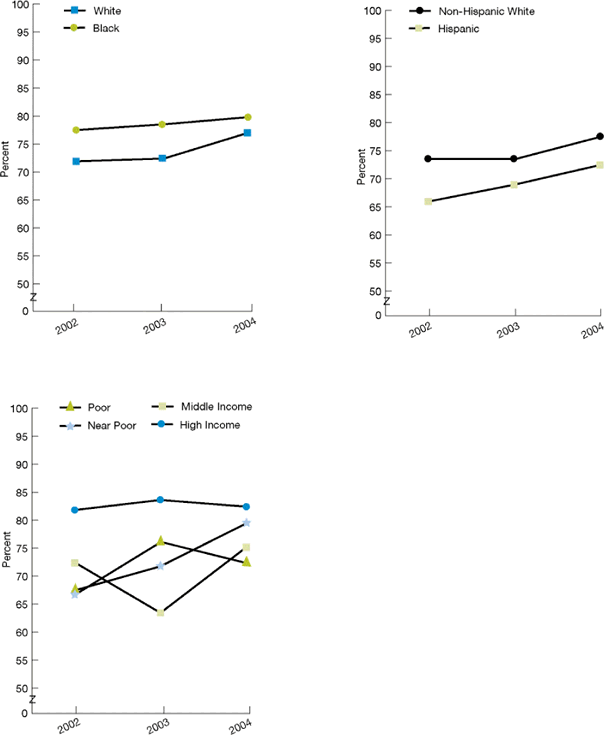
Source: Agency for Healthcare Research and Quality, Medical Expenditure Panel Survey, 2002-2004.
Reference population: Civilian noninstitutionalized population under age 18.
Note: Data were insufficient for this analysis for Asians, Native Hawaiians or Other Pacific Islanders, and American Indians and Alaska Natives.
- There were no statistical differences by race or ethnicity from 2002 to 2004 (Figure 4.63).
- From 2002 to 2004, the gap between poor children and high income children in the proportion of children with special health care needs who could always get care for illness or injury as soon as wanted remained the same.
- In 2004, the proportion was significantly lower for children from poor families than for children from high income families (72.2% compared with 82.4%).
- From 2002 to 2004, the gap between near poor children and high income children decreased. In 2004, there was no significant difference between near poor children and high income children (79.4% compared with 82.4%).
Patient Centeredness: Communication With Health Providers
Patient centered health care requires good communication to ensure that a patient's needs and preferences are best met. For CSHCN, good communication with the child's parent or guardian is especially important to ensure that their more complex and greater health care needs are optimally addressed.
Figure 4.64. Ambulatory patients (children with special health care needs) whose parents or guardians reported poor communication with health providers, by race (top left), ethnicity (top right), and family income (bottom left), 2002-2004
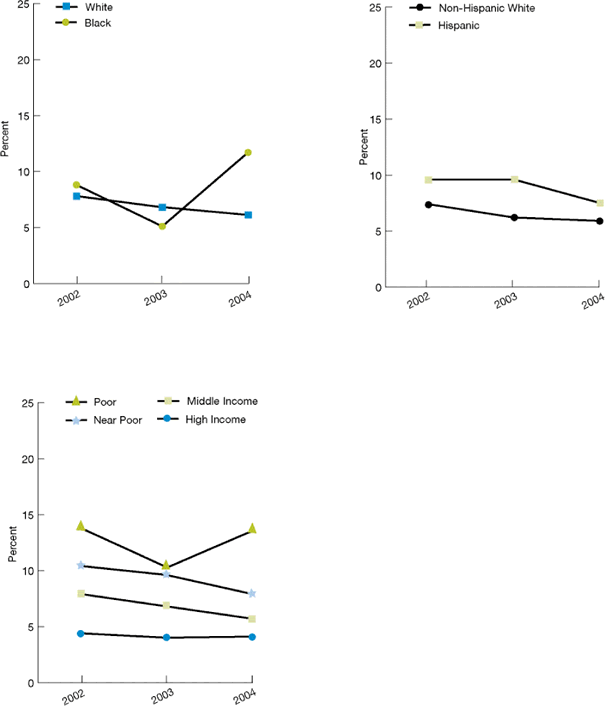
Source: Agency for Healthcare Research and Quality, Medical Expenditure Panel Survey, 2002-2004.
Denominator: Civilian noninstitutionalized population under age 18.
Note: Average percentage of children under age 18 with special health care needs who had a doctor's office or clinic visit in the last 12 months and poor communication with health providers was reported (i.e., their health providers sometimes or never listened carefully, explained things clearly, showed respect for what they had to say, or spent enough time with them). Data were insufficient for this analysis for Asians, Native Hawaiians or Other Pacific Islanders, and American Indians and Alaska Natives.
- From 2002 to 2004, the gap between children with special health care needs and children without special health care needs in the percentage of parents or guardians who reported poor communication with their health providers remained the same (data not shown; Figure 4.64). In 2004, the proportion of parents or guardians who reported poor communication with their health providers was significantly higher for CSHCN than for children without special health care needs (7.2% compared with 5.2%; data not shown).
- In 2004, the proportion of parents or guardians of CSHCN who reported poor communication with their health providers was significantly higher for Blacks than for Whites (11.7% compared with 6.7%).
- In 2004, the percentage of parents who reported communication problems was significantly higher for CSHCN in poor (13.6%) and near poor (7.9%) families than in high income (4.1%) families.

