Women
The U.S. Census Bureau estimated 150.4 million females in the United States in 2005, 51% of the U. S. population, of whom 49 million are members of racial or ethnic minority groups.33 By 2050, it is projected that just under half of females in the United States will be members of racial or ethnic minority groups.34 The ratio of males to females is highest at birth, when male infants outnumber female infants, and gradually declines with age due to higher male mortality rates. Among Americans 85 and older, women outnumber men by more than 2 to 1.35 Poverty disproportionately affects women; in 2005 almost 14.1% of women lived in households with incomes below the Federal poverty level.36
Women in the United States have a life expectancy 5.2 years longer than men37 and lower age-adjusted death rates than men for 12 of the 15 leading causes of death.38 However, women are more likely than men to report having arthritis, asthma,39 and serious mental illness.40 There is significant variation in health status and health-related behaviors for women of different races and ethnicities.41 In general, gender differences in quality of care are small.
Many measures of relevance to women are tracked in the NHDR. Findings presented here highlight four quality measures and one access measure of particular importance to women:
| Component of health care need |
Measure |
| Prevention |
Prenatal care/maternal health |
| Treatment |
Recommended care for heart attack |
| Management |
New AIDS cases, HIV testing during prenatal care |
| Access to care |
Usual source of care |
Additionally, this year the section on cancer in Chapter 2 focuses on breast cancer prevention.
Return to Contents
Quality of Health Care
Prevention: Prenatal Care/Maternal Health
Childbirth and reproductive care are the most common reasons for women of childbearing age to use health care; with more than 11,000 births each day in the United States, childbirth is the most common reason for hospital admission.42 Given that birth outcomes may have lifetime effects, good prenatal care has the potential to affect the future health and health care needs of the Nation.43 Prenatal care is expected to maintain and improve the health of both mother and newborn during pregnancy. It is recommended that women begin receiving prenatal care in the first trimester of pregnancy.
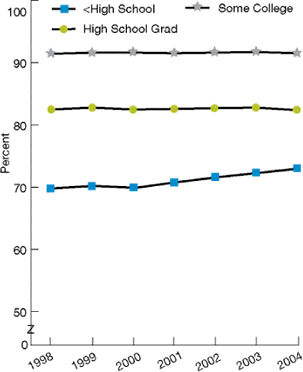
Figure 4.35. Pregnant women with prenatal care in the first trimester, by race (left), ethnicity (right), and education (below), 1998-2004

Key: API = Asian or Pacific Islander; AI/AN = American Indian or Alaska Native.
Source: Centers for Disease Control and Prevention, National Center for Health Statistics, National Vital Statistics System-Natality, 1998-2004.
Reference population: Women with live births.
- From 1998 to 2004, the gap between Blacks and Whites in the proportion of women who initiated prenatal care in the first trimester remained the same (Figure 4.35). In 2004, the proportion was significantly lower for Blacks (76.4%) and AI/ANs (69.9%) compared with Whites (85.4%).
- The gap between Hispanics and non-Hispanic Whites also remained the same during this time period. In 2004, the proportion was significantly lower for Hispanics than for non-Hispanic Whites (75.5% compared with 88.9%).
- The gap in early prenatal care between women with less than a high school education and women with any college education remained the same. In 2004, the proportion was significantly lower for women with less than a high school education (73.0%) and high school graduates (82.4%) than for women with any college education (91.5%).
- Only persons with any college education achieved the Healthy People 2010 target of 90% of pregnant women receiving prenatal care in the first trimester.
Racial and ethnic minorities are disproportionately of lower socioeconomic status than Whites.26 Since information about income is not typically collected on birth certificates, the source of some health data, education is commonly used as a proxy for socioeconomic status. To distinguish the effects of race, ethnicity, and education on quality of health care, this measure is stratified by level of education.
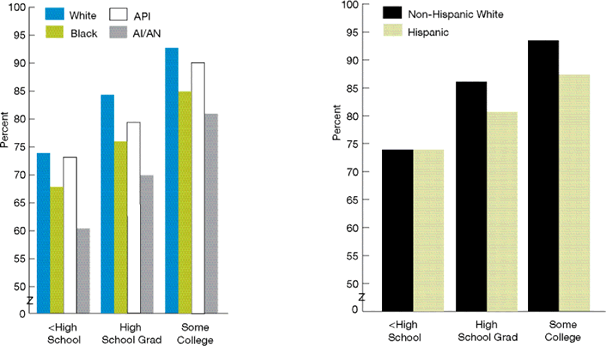
Figure 4.36. Pregnant women with prenatal care in the first trimester, by race (left) and ethnicity (right), stratified by education, 2004
Key: API = Asian or Pacific Islander; AI/AN = American Indian or Alaska Native.
Source: Centers for Disease Control and Prevention, National Center for Health Statistics, National Vital Statistics System-Natality, 2004.
Reference population: Women with live births.
- Education explains some but not all of the differences in prenatal care among women by race and ethnicity. Overall racial and ethnic differences in early prenatal care tended to persist among women with similar education (Figure 4.36).
- Only college-educated Whites (92.7%), APIs (90.2%), and non-Hispanic Whites (93.5%) achieved the Healthy People 2010 target of 90% of mothers receiving prenatal care in the first trimester.
Treatment: Recommended Hospital Care for Heart Attack
Each year, almost half a million women die of cardiovascular disease. Among these, 330,500 die of heart attacks.1 Although heart disease is the leading cause of death among both women and men, gender differences in cardiovascular care have been demonstrated and may relate to gender differences in disease presentation. Moreover, although major risk factors for cardiovascular disease can often be prevented or controlled through lifestyle changes, physicians are less likely to counsel women than men about diet, exercise, and substance abuse.44 After a first heart attack, women are less likely than men to receive cardiac rehabilitation45 and are more likely to die.46
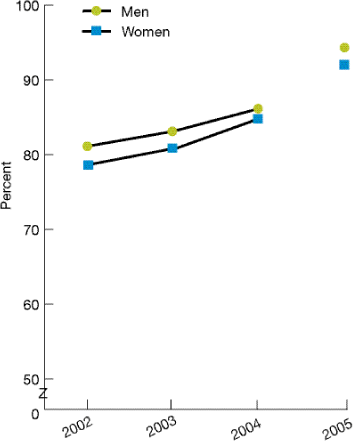
Figure 4.37. Recommended hospital care received by Medicare patients with heart attack, by gender, 2002-2005
Source: Centers for Medicare & Medicaid Services, Medicare Quality Improvement Organization Program, 2002-2005.
Denominator: Medicare beneficiaries hospitalized for heart attack.
Note: Composite is calculated by averaging the percentage of the population that received each of six components of care. Go to Chapter 1, Introduction and Methods, for composite details. Discontinuity of the trend line between 2004 and 2005 reflects the modification of the ACE inhibitor measure in 2005 to include receipt of angiotensin receptor blockers as an acceptable alternative to ACE inhibitors and the data collection method change made in 2005 from the abstraction of randomly selected medical records for Medicare beneficiaries to the receipt of hospital self-reported data for all payer types.
- In 2005, there was no significant gender difference in receipt of recommended hospital care after a heart attack by Medicare beneficiaries (Figure 4.37).
Management: New AIDS Cases
Although differences in developing AIDS do not necessarily result from differences in quality of care, early and appropriate treatment of HIV infection can delay progression to AIDS. Improved management of chronic HIV disease has likely contributed to declines in new AIDS cases.
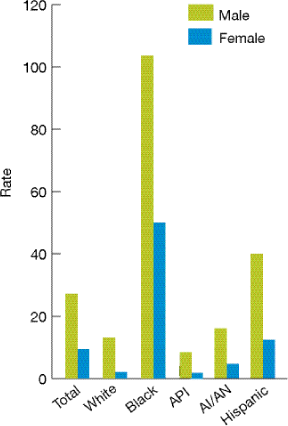
Figure 4.38. Number of new AIDS cases per 100,000 population age 13 and over, by race/ethnicity, stratified by gender, 2005
Key: API = Asian or Pacific Islander; AI/AN = American Indian or Alaska Native.
Source: Centers for Disease Control and Prevention, HIV/AIDS Surveillance System, 2005.
Reference population: U.S. population age 13 and over.
Note: The source categorizes race/ethnicity as a single item. White = non-Hispanic White; Black = non-Hispanic Black.
- For the overall U.S. population, the rate of new AIDS cases for males was nearly triple that for females (27.2 compared with 9.4 per 100,000 population; Figure 4.38).
- The rate was significantly higher for males than for females in all groups: Blacks (103.6 per 100,000 for males and 49.9 per 100,000 for females), APIs (8.2 per 100,000 for males and 1.8 per 100,000 for females), AI/ANs (15.9 per 100,000 for males and 4.4 per 100,000 for females), Hispanics (39.7 per 100,000 for males and 12.2 per 100,000 for females), and Whites (13.1 per 100,000 for males and 2.1 per 100,000 for females).
- No group has yet achieved the Healthy People 2010 target of 1.0 new AIDS case per 100,000 population.
Management: HIV Testing During Prenatal Care
Although blood donations are routinely screened for HIV, it is important to track HIV screening in a health care setting to determine the impact of preventive care on the population. HIV-infected patients have years of life to gain if treatment is initiated early, before symptoms develop. HIV testing is recommended for all pregnant women during prenatal care and for people with high-risk behaviors for developing HIV.
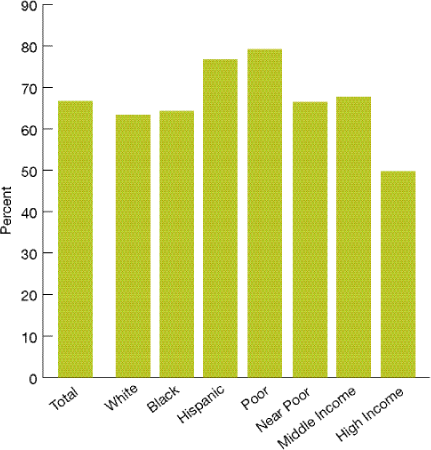
Figure 4.39. Women ages 15-44 who completed a pregnancy in the last 12 months and had an HIV test as part of prenatal care, by race/ethnicity and income, 2002
Source: Centers for Disease Control and Prevention, National Center for Health Statistics, National Survey of Family Growth, 2002.
Reference population: Household population of women ages 15-44.
- In 2002, the proportion of pregnant women ages 15-44 who had an HIV test as part of prenatal care was higher for Hispanics than for non-Hispanic Whites (76.7% compared with 63.4%; Figure 4.39).
- In 2002, the proportion of pregnant women who had an HIV test as part of prenatal care was higher for poor (79.2%), near poor (66.5%), and middle income women (67.7%) than for high income women (49.7%).
Return to Contents
Access to Care
Usual Source of Care
Higher costs, poorer outcomes, and greater disparities are observed among individuals without a usual source of care.47
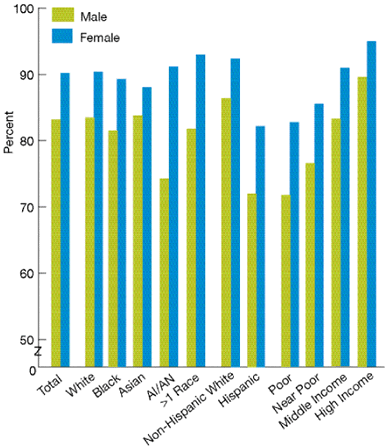
Figure 4.40. Persons with a specific source of ongoing care, by race, ethnicity, and income, stratified by gender, 2005
Key: AI/AN = American Indian or Alaska Native.
Source: Centers for Disease Control and Prevention, National Center for Health Statistics, National Health Interview Survey, 2005.
Reference population: Civilian noninstitutionalized population, all ages.
Notes: Measure is age adjusted to the 2000 standard population.
- Overall, the proportion of persons with a specific source of ongoing care was significantly higher for females than for males (90.3% compared with 83.3%).
- This proportion was also significantly higher for females than males for all racial and ethnic groups: Whites (90.5% for females compared with 83.6% for males), Blacks (89.3% for females compared with 81.5% for males), AI/ANs (91.2% for females compared with 74.3% for males), non-Hispanic Whites (92.4% for females compared with 86.4% for males), and Hispanics (82.2% for females compared with 72.0% for males; Figure 4.40).
- This proportion was significantly lower for the poor (78.1%), near poor (81.4%) and middle income (87.2%) groups than for high income groups (92.3%).
Return to Contents
Children
Children made up 24.8%3 of the U.S. population, or 73.5 million people, in 2005.48 Almost 40% of all children were members of racial and ethnic minority groups,1 and 17.6% of children lived in families with incomes below the Federal poverty level.26
In 2003, Black children and AI/AN children had death rates about 1.5 to 2 times higher than White children. Black infants were more than twice as likely as White infants to die during their first year. Life expectancy at birth was 78.3 years for White children38 and 73.1 years for Black children, a difference of about 5%.49
Many measures relevant to children are tracked in the NHDR. Findings presented here highlight eight quality measures and two access measures of particular importance to children (for ages 2 months to 19 years, depending on the measure):
| Component of health care need |
Measure |
| Prevention |
Vaccinations, counseling about overweight, counseling about healthy eating, dental care |
| Treatment |
Hospital admissions for pediatric gastroenteritis |
| Management |
Hospital admissions for pediatric asthma |
| Timeliness |
Care for illness or injury as soon as wanted |
| Patient centeredness |
Poor communication with health providers |
| Access to care |
Health insurance, mental health care |
In addition, the final section of this chapter, which discusses individuals with special health care needs, includes findings related to children with special health care needs.
Return to Contents
Quality of Health Care
Prevention: Early Childhood Vaccinations
Childhood vaccinations protect recipients from illness and disability and protect others in the community. Vaccinations are important for reducing mortality and morbidity in populations.
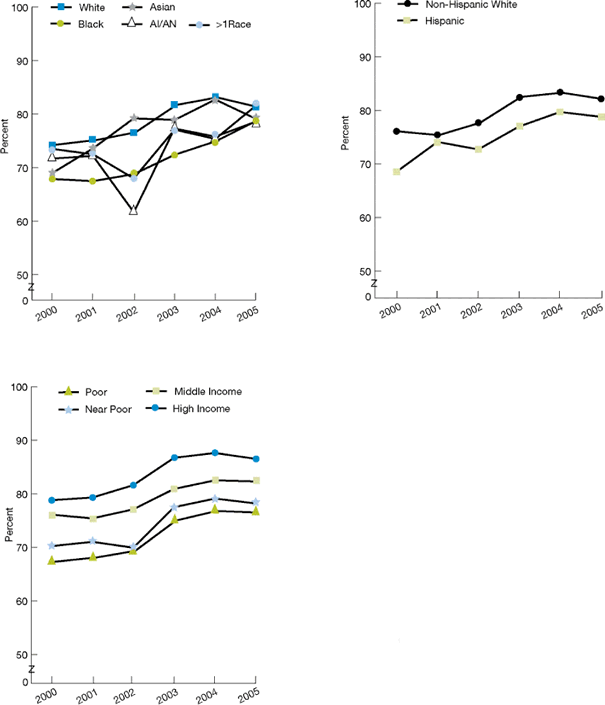
Figure 4.41. Children ages 19-35 months who received all recommended vaccines, by race (top left), ethnicity (top right), and income (bottom left), 2000-2005
Key: AI/AN = American Indian or Alaska Native.
Source: Centers for Disease Control and Prevention, National Center for Health Statistics, National Immunization Survey, 2000-2005.
Reference population: Civilian noninstitutionalized population ages 19-35 months.
Note: Recommended vaccines for children 19-35 months are based on the Healthy People 2010 objective and do not include varicella vaccine or vaccines added to the recommended schedule after 1998 for children up to 35 months of age. Racial categories changed in 2000 and may not be comparable with those used for previous years. More information can be found in the Measure Specifications Appendix.
- From 2000 to 2005, the gap between Blacks and Whites, Asians and Whites, and children of multiple races and Whites who received all recommended vaccines decreased (Figure 4.41). In 2005, significant differences by race were not observed on this measure.
- The gap between Hispanics and non-Hispanic Whites in the proportion of children who received all recommended vaccines decreased during this time period. However, in 2005, the proportion of children who received all recommended vaccines was still lower for Hispanics than for non-Hispanic Whites (78.8% compared with 82.1%).
- The gap between children from poor families and children from high income families remained the same. In 2005, the proportion of children who received all recommended vaccines was lower for children from poor (76.5%), near poor (78.2%), and middle income families (82.3%) than for children from high income families (86.5%).
- Nationally, only vaccination coverage levels among White (81.3%), non-Hispanic White (82.1%), middle income (82.3%), and high income (86.5%) children achieved the Healthy People 2010 objective of 80% of children receiving all recommended vaccines.
Prevention: Counseling About Overweight
Childhood overweight poses a risk for health problems, including heart disease and Type 2 diabetes, and is associated with adult obesity. Lack of awareness is a key problem. Addressing childhood overweight begins with measuring the height and weight of all children and counseling those who are overweight.
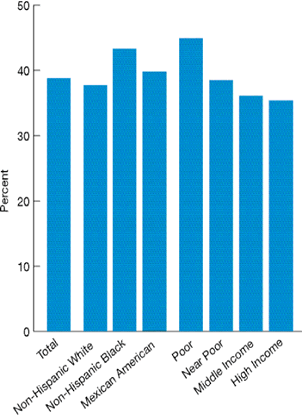
Figure 4.42. Overweight children ages 2-19 who were told by a doctor or health professional that they were overweight, by race, ethnicity, and income, 1999-2004
Source: Centers for Disease Control and Prevention, National Center for Health Statistics, National Health and Nutrition Examination Survey, 1999-2004.
Reference population: Overweight civilian noninstitutionalized population ages 2-19. Overweight is defined as persons ages 2-19 with a body mass index (BMI) greater than or equal to the 95th percentile on the BMI for age-sex-specific 2000 Centers for Disease Control and Prevention growth charts for the United States.
Note: Estimates were for children whose parents or guardians were told the child was overweight. "Mexican Americans" are shown in place of Hispanics because this is how data are collected by the data source.
- Overall, 38.8% of overweight children ages 2-19 or their parents or guardians were told by a health care provider that they were overweight (Figure 4.42).
- No statistically significant differences in overweight children being told by a health care provider that they were overweight were observed between any populations.
- In no group were even half of overweight children told they were overweight.
Prevention: Counseling About Healthy Eating
Unhealthy eating and lack of physical activity contribute to overweight in children. Routine promotion of healthy eating among children is widely recommended and may help them develop eating habits that will last into adulthood, thereby influencing better long-term health.
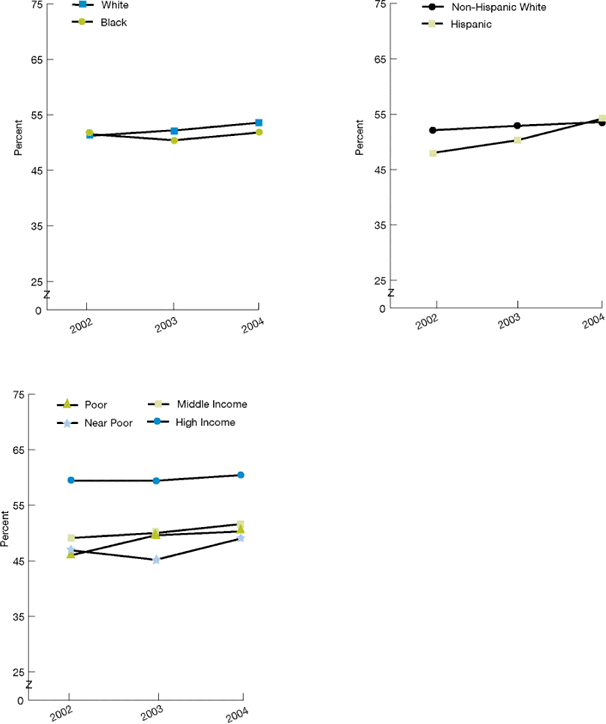
Figure 4.43. Children ages 2-17 whose parents or guardians reported advice from a doctor or other health provider about healthy eating, by race (top left), ethnicity (top right), and income (bottom left), 2002-2004
Source: Agency for Healthcare Research and Quality, Medical Expenditure Panel Survey, 2002-2004.
Reference population: Civilian noninstitutionalized population ages 2-17.
- From 2002 to 2004, the gap between poor and high income families in the proportion of children whose parents or guardians reported advice from a health provider about healthy eating remained the same (Figure 4.43). In 2004, the proportion of children whose parents or guardians reported advice from a health provider about healthy eating was significantly lower for children from poor (50.3%), near poor (49%), and middle income (51.6%) families than for children from high income families (60.4%).
- Significant differences by race and ethnicity were not observed.
Prevention: Dental Care
Regular dental visits promote prevention, early diagnosis, and optimal treatment of craniofacial diseases and conditions,50 including prevention of dental caries. Healthy People 2010's goals for reductions in childhood dental caries include decreases from 18% to 11% for children ages 2-4 and from 61% to 51% for 15-year-olds, and the goals for reduction in childhood untreated decays include decreases from 16% to 9% for ages 2-4 and from 20% to 15% for 15-year-olds.51
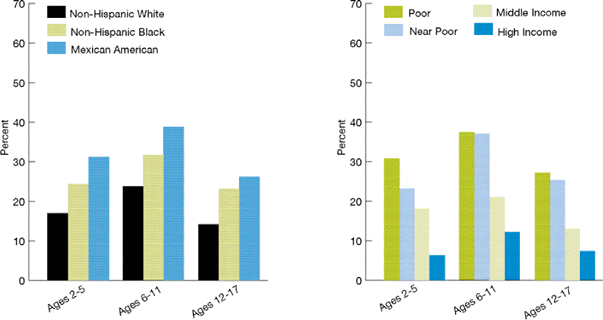
Figure 4.44. Children ages 2-5, 6-11, and 12-17 with untreated dental caries, by race/ethnicity (left) and income (right), 1999-2004
Source: Centers for Disease Control and Prevention, National Center for Health Statistics, National Health and Nutrition Examination Survey, 1999-2004.
Reference population: Civilian noninstitutionalized population ages 2-5, 6-11, and 12-17.
Note: In the survey, children ages 2-5 were examined for untreated dental caries in their primary teeth, children ages 6-11 were examined for both primary and permanent teeth, and children ages 13-17 were examined for dental caries in their permanent teeth. These data were collected for Mexican Americans rather than all Hispanics. Whites and Blacks are non-Hispanics. Data from 1999-2004 were pooled to get sufficient sample sizes for analyses.
- During the period 1999-2004, the proportion of children ages 2-5 with untreated dental caries was higher for Blacks (24.4%) and Mexican Americans (31.2%) than for Whites (17.0%); it also was higher for poor (30.8%), near poor (23.2%), and middle income children (18.2%) than for high income children (6.3%; Figure 4.44).
- For this time period, the proportion of children ages 6-11 with untreated dental caries was higher for Blacks (31.6%) and Mexican Americans (38.8%) than for Whites (23.7%), and it was higher for poor (37.3%), near poor (36.9%), and middle income children (21%) than for high income children (12.1%).
- The proportion of children ages 12-17 with untreated dental caries was higher for Blacks (23.1%) and Mexican Americans (26.2%) than for Whites (14.2%), and it was higher for poor (27.2%), near poor (25.4%), and middle income children (13.0%) than for high income children (7.2%).
To improve overall oral health, Healthy People 2010 also set a goal of increasing the percentage of persons age 2 and older using the oral health system annually from 44% to 56%.
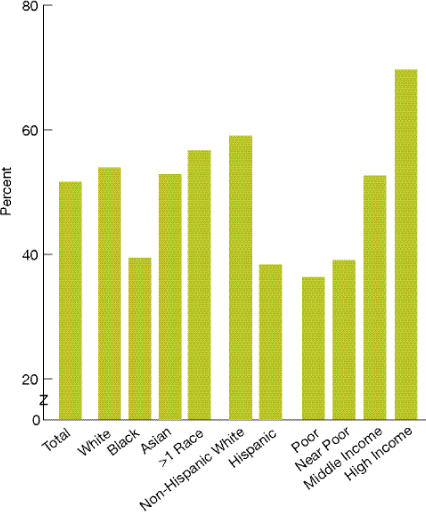
Figure 4.45. Children ages 2-17 with a dental visit in the past year, by race, ethnicity, and income, 2004
Source: Agency for Healthcare Research and Quality, Medical Expenditure Panel Survey, 2004.
Reference population: Civilian noninstitutionalized population ages 2-17.
- In 2004, the proportion of children with a dental visit in the past year was lower for Blacks than for Whites (39.3% compared with 53.9%) and for Hispanics than for non-Hispanic Whites (38.3% compared with 59.0%).
- The proportion of children with a dental visit in the past year was also lower for poor (36.3%), near poor (39.0%), and middle income (52.6%) children compared with high income children (69.6%; Figure 4.45).
Treatment: Hospital Admissions for Pediatric Gastroenteritis
Pediatric gastroenteritis can develop into a life-threatening condition due to dehydration, especially among infants. Proper outpatient treatment of gastroenteritis may prevent hospitalization, and lower hospitalization rates may reflect access to better quality care.
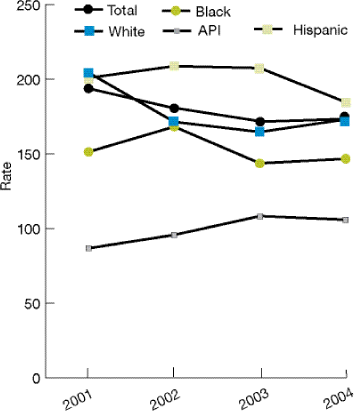
Figure 4.46. Hospital admissions for pediatric gastroenteritis per 100,000 population ages 4 months to 17 years, by race/ethnicity, 2001-2004
Key: API = Asian or Pacific Islander.
Source: Agency for Healthcare Research and Quality, Healthcare Cost and Utilization Project (HCUP) State Inpatient Databases (SID) disparities analysis file, 2001-2004. The HCUP SID disparities analysis file is designed to provide national estimates using weighted records from a sample of hospitals from 23 States that have 64% of the U.S. resident population.
Denominator: Children ages 4 months to 17 years.
Note: White, Black, and API are non-Hispanic groups.
- From 2001 to 2004, the gap in the rate of pediatric gastroenteritis admissions between Blacks and Whites and between APIs and Whites decreased (Figure 4.46). In 2004, admissions for pediatric gastroenteritis were significantly lower for Black children (146.7 per 100,000) and API children (105.8 per 100,000) than for White children (173.1 per 100,000).
Management: Hospital Admissions for Pediatric Asthma
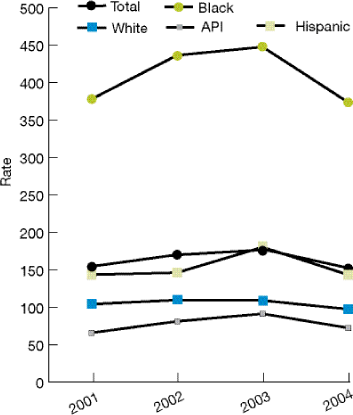
Children are more likely than adults to have asthma. The prevalence rate for children under age 18 is 83 per 1,000, while the prevalence rate for adults age 18 and older is 68 per 1,000.52 Emergency room visit rates for asthma are highest among children under age 5 (62 per 10,000 population). Proper outpatient treatment of asthma may prevent hospitalization, and lower hospitalization rates may reflect access to better quality care. Differences in rates may also vary across racial and ethnic groups due to differences in prevalence.
Figure 4.47. Pediatric asthma admissions per 100,000 population ages 2-17 years, by race/ethnicity, 2001-2004
Key: API = Asian or Pacific Islander.
Source: Agency for Healthcare Research and Quality, Healthcare Cost and Utilization Project (HCUP) State Inpatient Databases (SID) disparities analysis file, 2001-2004. The HCUP SID disparities analysis file is designed to provide national estimates using weighted records from a sample of hospitals from 23 States that have 64% of the U.S. resident population.
Denominator: Children ages 2-17.
Note: White, Black, and API are non-Hispanic groups.
- From 2001 to 2004, the gap between Whites and other racial/ethnic groups in the rate of pediatric asthma admissions remained the same (Figure 4.47).
- In 2004, the rate of pediatric asthma admissions was significantly higher for Black children (373.9 per 100,000) and Hispanic children (143.7 per 100,000) than for White children (97.8 per 100,000).
- In 2004, the rate was significantly lower for API children (72.7 per 100,000) than for White children (97.8 per 100,000).
- No population has yet achieved the Healthy People 2010 target of 17.3 pediatric asthma admissions per 100,000 population ages 2-17.
Timeliness: Care for Illness or Injury as Soon as Wanted
Children often need care for illness or injury. Timely receipt of health care can prevent disease complications, alleviate discomfort, and reduce child and parental anxiety.
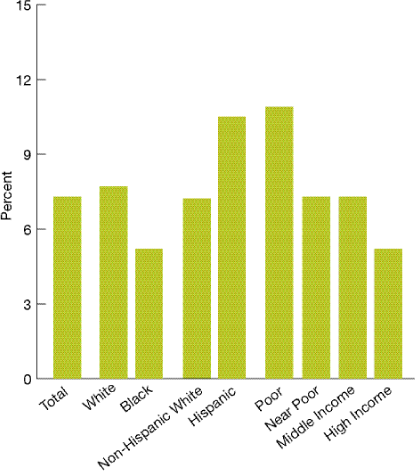
Figure 4.48. Children under age 18 whose parents or guardians reported that their child sometimes or never got care for illness or injury as soon as wanted in the past year, by race, ethnicity, and income, 2004
Source: Agency for Healthcare Research and Quality, Medical Expenditure Panel Survey, 2004.
Reference population: Civilian noninstitutionalized population under age 18.
- The proportion of children who sometimes or never got care for illness or injury as soon as wanted was significantly higher for children from poor families than for children from high income families (10.9% compared with 5.2%; Figure 4.48).
- There were no significant differences observed between Blacks and Whites and between Hispanics and non-Hispanic Whites.
Patient Centeredness: Communication With Health Providers
Communication in children's health care can pose a particular challenge, as children are often less able to express their health care needs and preferences, and a third party (i.e., a parent or guardian) is involved in communication and decision-making. Optimal communication in children's health care can therefore have a significant impact on receipt of high quality care and subsequent health status. This is especially true for children with special health care needs (CSHCN).
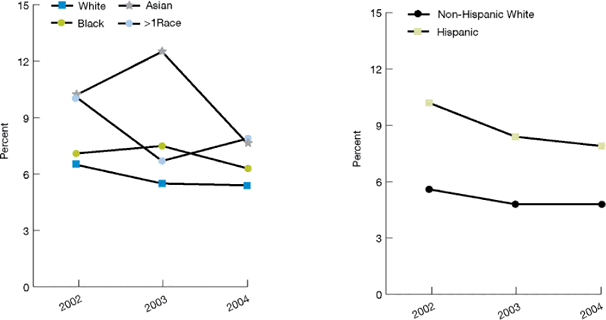
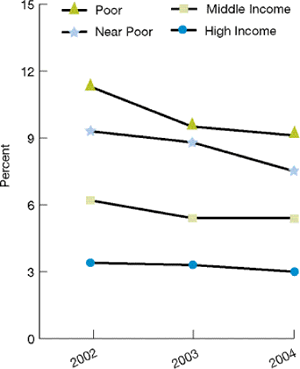
Figure 4.49. Composite measure: Ambulatory patients (children under age 18) whose parents or guardians reported poor communication with health providers, by race (left), ethnicity (right), and family income (below), 2002-2004
Source: Agency for Healthcare Research and Quality, Medical Expenditure Panel Survey, 2002-2004.
Composite measure includes the following measures: Children under 18 years of age whose parents or guardians reported that their child's health providers sometimes or never listened carefully, explained things clearly, respected what they had to say, or spent enough time with them.
Denominator: Civilian noninstitutionalized population under age 18.
Note: Average percentage of children who had a doctor's office or clinic visit in the last 12 months and were reported to have had poor communication with health providers (i.e., that their health providers sometimes or never listened carefully, explained things clearly, showed respect for what they had to say, or spent enough time with them).
- In 2004, there were no significant differences between Blacks, Asians, and Whites in the proportion of children whose parents or guardians reported poor communication with their health providers.
- From 2002 to 2004, the gap between Hispanics and non-Hispanic Whites in the proportion of children whose parents or guardians reported poor communication with their health providers decreased (Figure 4.49). In 2004, the proportion was significantly higher for Hispanics than non-Hispanic Whites (7.9% compared with 4.8%).
- The gap between poor people and high income people in the proportion with poor communication remained the same. In 2004, the proportion was significantly higher for poor (9.1%), near poor (7.5%), and middle income (5.4%) persons than for high income persons (3.0%).
Return to Contents
Access to Health Care
Health Insurance
Insurance coverage is among the most important factors in access to health care. Special efforts have been made to provide insurance coverage to children.53
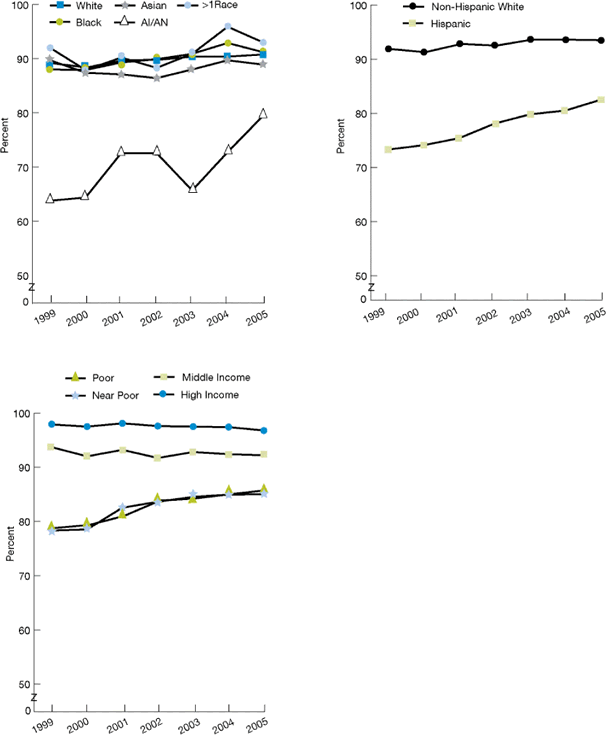
Figure 4.50. Children under age 18 with health insurance, by race (top left), ethnicity (top right), and family income (bottom), 1999-2005
Key: AI/AN = American Indian or Alaska Native.
Source: Centers for Disease Control and Prevention, National Center for Health Statistics, National Health Interview Survey, 1999-2005.
Reference population: Civilian noninstitutionalized population under age 18.
Note: Insurance status is determined at the time of interview. Children are considered uninsured if they lack private health insurance, public assistance (including the State Children's Health Insurance Program), Medicare, Medicaid, a State-sponsored health plan, other government-sponsored programs, or a military health plan, or if their only coverage is through the Indian Health Service. This measure reflects the percentage of children who were covered by health insurance at the time of the interview.
- From 1999 to 2005, the gap between AI/ANs and Whites, between Hispanics and non-Hispanic Whites, and between poor and high income people in the proportion of children with health insurance decreased (Figure 4.50).
- In 2005, the proportion of children with health insurance was significantly lower for AI/AN children than for White children (79.5% compared with 90.8%).
- In 2005, the proportion of children with health insurance was significantly lower for Hispanic children than for non-Hispanic White children (82.5% compared with 93.5%).
- In 2005, the proportion of children with health insurance was significantly lower for poor (85.7%) and near poor children (85.0%) than for high income children (96.8%).
Mental Health Care
The prevalence of mental disorders for racial and ethnic minorities in the United States is similar to that for Whites,54 but previous research has shown evidence that minorities have less access to mental health care and are less likely to receive needed services.55 These differences may reflect, in part, socioeconomic status and variation in preferences and cultural attitudes toward mental health and mental health care. Among children and adolescents, the most frequently diagnosed mood disorders are major depressive disorder, dysthymic disorder, and bipolar disorder.54 Because mood disorders such as depression substantially increase the risk of suicide, suicidal behavior is a matter of serious concern for clinicians who deal with the mental health problems of children and adolescents.54
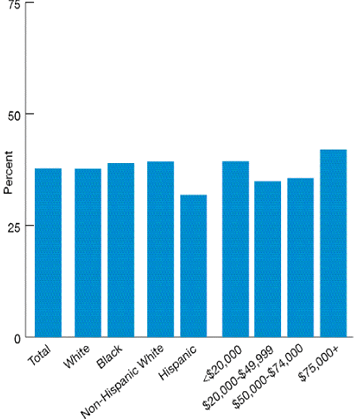
Figure 4.51. Children ages 12-17 with a major depressive episode in the past year who received treatment in the past year, by race, ethnicity, and family income, 2005
Source: Substance Abuse and Mental Health Services Administration, National Survey on Drug Use and Health, 2005.
Note: Data for Asians, Native Hawaiian or Other Pacific Islander, American Indian or Alaska Native, and multiple races did not meet criteria for statistical reliability due to small sample sizes.
Reference population: U.S. population ages 12-17 with a major depressive episode in the past year.
- There were no statistically significant differences on the basis of race, ethnicity, or family income in the proportion of children ages 12-17 with a major depressive episode who received treatment for depression in the past year (Figure 4.51).
- In 2005, in no group did even half of children ages 12-17 with a major depressive episode receive treatment for depression in the past year.
Return to Contents
Elderly
In 2005, 36.8 million persons age 65 and over lived in the United States.56 Further, the proportion of the population over age 65 is swiftly increasing: people 65 and over represented 12.4% of the population in 2005 but are expected to grow to about 20% of the population by 2030.57 The past century has seen significant increases in life expectancy, and 65-year-olds today can expect to live an additional 18.5 years.1 Nonetheless, the elderly face greater health care concerns than younger populations. In 2006, 38.9% of noninstitutionalized older persons assessed their health as excellent or very good, compared with 65.1% of persons ages 18-64,58 and the majority of older persons have at least one chronic condition.
Older women outnumber older men by over one-third.59 Members of minority groups are projected to represent over 25% of the elderly in 2030, up from about 16% in 2000. About 3.6 million elderly lived below the poverty level in 2004, corresponding to a poverty rate of 9.8%.59 Another 2.3 million, or more than 6.7% of the elderly, were classified as near poor, with incomes between 100% and 125% of the Federal poverty level.59
The Medicare program provides core health insurance to nearly all elderly Americans and reduces many financial barriers to acute and post-acute care services. The Medicare Prescription Drug Improvement and Modernization Act of 2003 has added new prescription drug and preventive benefits to Medicare and provides extra financial help to persons with low incomes. Consequently, differences in access to and quality of health care tend to be smaller among Medicare beneficiaries than among younger populations.
Surveys of the general population often do not include enough elderly to examine racial, ethnic, or socioeconomic differences in health care. Consequently, the NHDR relies upon data from the Medicare Current Beneficiary Survey to examine disparities in access to and quality of care. Findings presented here highlight two quality measures and one access measure of particular importance to the elderly:
| Component of health care need |
Measure |
| Prevention |
Influenza vaccination, dental care |
| Access to care |
Delayed care due to cost |
Return to Contents
Quality of Health Care
Prevention: Influenza Vaccination
Influenza is responsible for significant morbidity and decreased productivity during outbreaks. Elderly persons are at increased risk for complications from influenza infections. Vaccination is an effective strategy to reduce illness and deaths due to influenza, and annual influenza vaccination of all elderly individuals is recommended by the U.S. Preventive Services Task Force and the Centers for Disease Control and Prevention.
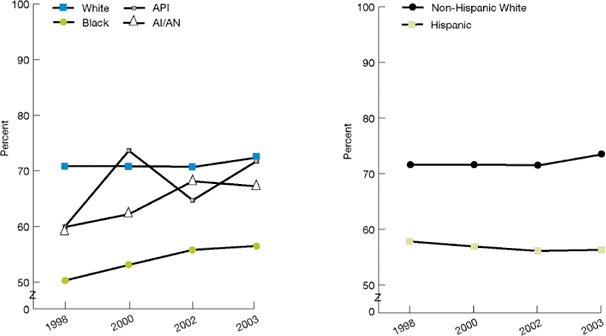
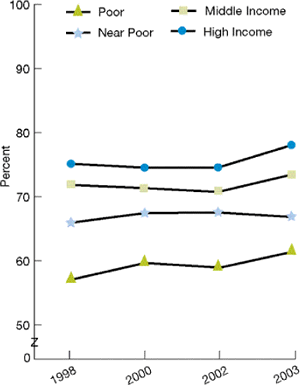
Figure 4.52. Elderly Medicare beneficiaries with influenza vaccination in the past year by race (left), ethnicity (right), and income (below), 1998, 2000, 2002, and 2003
Key: AI/AN = American Indian or Alaska Native; API = Asian or Pacific Islander.
Source: Centers for Medicare & Medicaid Services, Medicare Current Beneficiary Survey, 1998, 2000, 2002, 2003.
Reference population: Medicare beneficiaries age 65 and over living in the community.
- From 1998 to 2003, there were no significant changes in the proportion of elderly Medicare beneficiaries with an influenza vaccination in the past year (data not shown).
- In 2003, the proportion was significantly lower for Blacks than for Whites (56.5% compared with 72.4%; Figure 4.52).
- In 2003, the proportion was also significantly lower for Hispanics than for non-Hispanic Whites (56.3% compared with 73.5%).
- In 2003, the proportion was significantly lower for poor (61.4%), near poor (66.8%), and middle income (73.4%) beneficiaries than for high income beneficiaries (78.0%).
- In 2003, the Healthy People 2010 target of 90% of elderly Americans with influenza vaccination was not yet achieved by any population group.
Prevention: Dental Care
Regular dental visits improve prevention, early diagnosis, and optimal treatment of craniofacial diseases and conditions. Missed dental care can result in delayed diagnosis, overall compromised health, and, occasionally, even death.60 Because dental conditions often develop across a lifetime, it is especially important for the elderly to receive regular dental care to ensure optimal treatment.
Figure 4.53. Elderly Medicare beneficiaries receiving dental care by race (top left), ethnicity (top right), and income (bottom left), 1998-2003
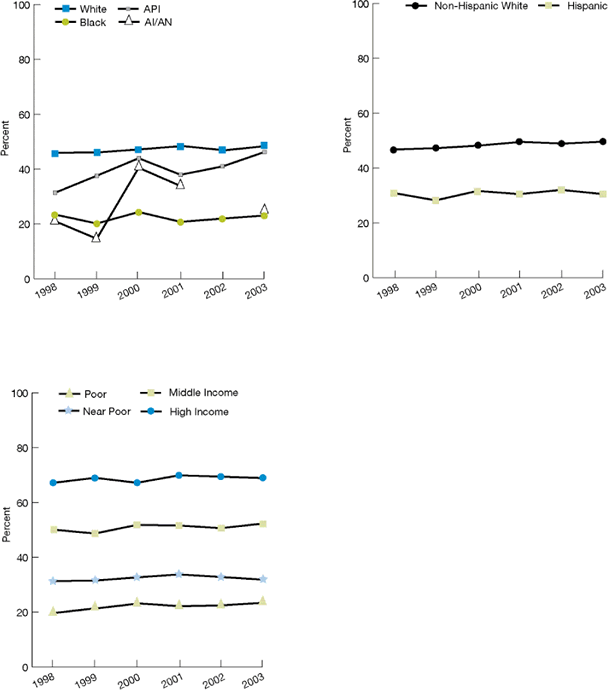
Key: AI/AN=American Indian or Alaska Native; API = Asian or Pacific Islander.
Source: Centers for Medicare & Medicaid Services, Medicare Current Beneficiary Survey, 1998-2003.
Reference population: Medicare beneficiaries age 65 and over living in the community.
Note: Although these data were collected via the Medicare Current Beneficiary Survey, much of the dental care reported here is likely not connected to the Medicare program, as Medicare generally does not cover dental services.
- From 1998 to 2003, the gap between Black and White elderly Medicare beneficiaries who had a dental visit remained the same. In 2003, Blacks were significantly less likely than Whites to have a dental visit (23% compared with 48.4%; Figure 4.53).
- The gap between Hispanic and non-Hispanic White elderly Medicare beneficiaries increased. In 2003, Hispanics were significantly less likely than non-Hispanic Whites to have a dental visit (30.5% compared with 49.6%).
- The gap between poor elderly Medicare beneficiaries and high income elderly Medicare beneficiaries decreased. However, in 2003, poor individuals were still less likely than high income individuals to have a dental visit (23.4% compared with 68.9%).
Return to Contents
Access to Care
Delayed Care Due to Cost
Timely delivery of appropriate care has been shown to improve health care outcomes and reduce health care costs. Timely receipt of care is especially important for the elderly due to the often increased medical needs of this population. Delayed health care can lead to diagnosis at a more advanced disease stage and reduce opportunities for optimal treatment.xiii
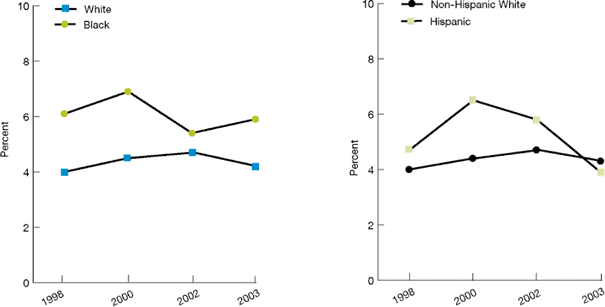
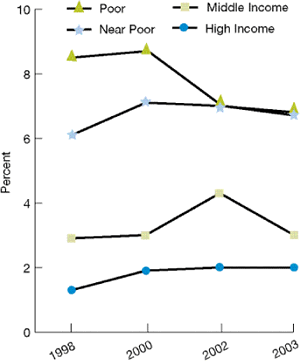
Figure 4.54. Elderly Medicare beneficiaries who delayed health care due to cost by race (left), ethnicity (right), and income (below), 1998, 2000, 2002, and 2003
Source: Centers for Medicare & Medicaid Services, Medicare Current Beneficiary Survey, 1998, 2000, 2002, 2003.
Reference population: Medicare beneficiaries age 65 and over living in the community.
- There were no significant differences by race or ethnicity in the proportion of elderly Medicare beneficiaries who delayed health care due to cost.
- From 1998 to 2003, there were no significant changes in the gap between poor and high income people in the proportion of elderly Medicare beneficiaries who delayed care due to cost (Figure 4.54). In 2003, the percentage delaying care was significantly higher for poor (6.7%) and near poor (6.8%) beneficiaries than for high income beneficiaries (2.0%).
xiii In this measure, delayed care due to cost is self-reported by patients.

