Feeds & Data
M 6.1 - SOUTHERN IRAN
Wednesday, September 10, 2008 at 11:00:34 UTCLocation: 26.8°N 55.8°E Depth: 15km
Alert version 6
Summary
Estimated Population Exposed to Earthquake Shaking
| Est. Modified Mercalli Intensity | Est. Population Exposure (k = x1000) | Perceived Shaking | Potential Structure Damage | |
|---|---|---|---|---|
| Resistant | Vulnerable | |||
| X | 0 | Extreme | V. Heavy | V. Heavy |
| IX | 0 | Violent | Heavy | V. Heavy |
| VIII | 7k | Severe | Moderate/Heavy | Heavy |
| VII | 16k | Very Strong | Moderate | Moderate/Heavy |
| VI | 20k | Strong | Light | Moderate |
| V | 595k | Moderate | V. Light | Light |
| IV | 4,844k* | Light | None | None |
| II-III | 2k* | Weak | None | None |
| I | --* | Not Felt | None | None |
| MMI | City | Population |
|---|---|---|
| V | Khasab | 17k |
| V | Bandar-e Lengeh | 22k |
| IV | Umm al Qaywayn | 44k |
| IV | Ra's al Khaymah | 115k |
| IV | Minab | 70k |
| IV | Khawr Fakkan | 33k |
| IV | Dubai | 1137k |
| IV | 'Ajman | 226k |
| IV | Sharjah | 543k |
| IV | Sirjan | 207k |
| IV | Abu Dhabi | 603k |
Overall, the population in this region resides in structures that are highly vulnerable to earthquake shaking, though some resistant structures exist. A magnitude 6.6 earthquake 326 km Northeast of this one struck Bam, Iran on December 26, 2003 (UTC), with estimated population exposures of 75,000 at intensity IX or greater and 6,000 at intensity VIII, resulting in an estimated 26,271 fatalities. Recent earthquakes in this area have caused landslides that may have contributed to losses.
PAGER results are generally available on the Internet within 30 minutes of the earthquake's occurrence. However, information on the extent of shaking will be uncertain in the minutes and hours following an earthquake and typically improves as additional sensor data and reported intensities are acquired and incorporated into models of the earthquake's source. Users of PAGER exposure estimates should account for uncertainty and always seek the most current PAGER release for any earthquake.
Maps
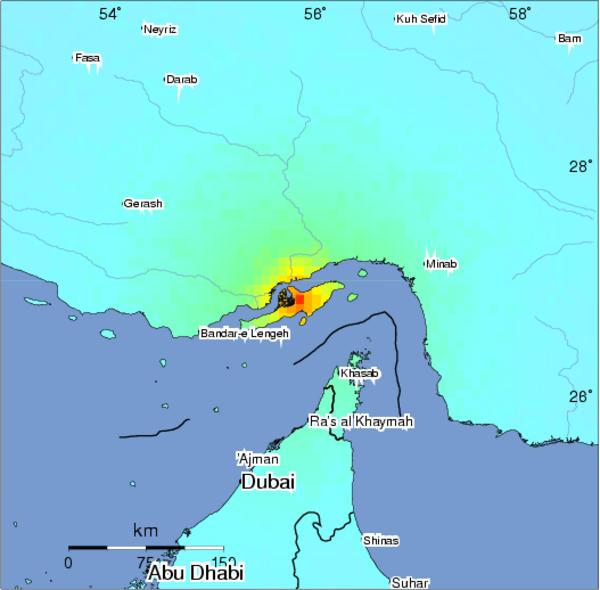
Map of MMI contours plotted over population per ˜1 square km (see gray scale bar on top of map). The regions of integer MMI values are separated by the thick contour lines and labeled with Roman numerals. The total population exposure to a given MMI value is obtained by summing the population between the thick contour lines. This total is shown in population exposure table.
Map of shaking intensity. This map shows the estimated MMI as a continuous color scale. The ground shaking estimates can be obtained from http://earthquake.usgs.gov/shakemap/global/shake/2008wua9.
Exposure
| Est. Modified Mercalli Intensity | Est. Population Exposure (k = x1000) | Perceived Shaking | Potential Structure Damage | |
|---|---|---|---|---|
| Resistant | Vulnerable | |||
| X | 0 | Extreme | V. Heavy | V. Heavy |
| IX | 0 | Violent | Heavy | V. Heavy |
| VIII | 7k | Severe | Moderate/Heavy | Heavy |
| VII | 16k | Very Strong | Moderate | Moderate/Heavy |
| VI | 20k | Strong | Light | Moderate |
| V | 595k | Moderate | V. Light | Light |
| IV | 4,844k* | Light | None | None |
| II-III | 2k* | Weak | None | None |
| I | --* | Not Felt | None | None |
Table showing population exposed to different estimated Modified Mercalli Intensity (MMI) levels and the possible damage at different intensity levels for resistant and vulnerable structures. MMI describes the severity of an earthquake in terms of its effect on humans and structures and is a rough measure of the amount of shaking at a given location. Unlike earthquake magnitude, intensity varies with distance from the fault, and is influenced by the depth of the earthquake and the types of soils in the shaken region. Population outside the map bounds are not included in the totals.
Cities
| MMI | City | Population |
|---|---|---|
| V | Khasab | 17k |
| V | Bandar-e Lengeh | 22k |
| IV | Umm al Qaywayn | 44k |
| IV | Ra's al Khaymah | 115k |
| IV | Minab | 70k |
| IV | Khawr Fakkan | 33k |
| IV | Gerash | 25k |
| IV | Dubai | 1137k |
| IV | Al Fujayrah | 62k |
| IV | 'Ajman | 226k |
| IV | Sharjah | 543k |
| IV | Shinas | 48k |
| IV | Al Liwa' | 26k |
| IV | Suhar | 108k |
| IV | Sirjan | 207k |
| IV | Abu Dhabi | 603k |
| IV | Neyriz | 45k |
| IV | Darab | 63k |
| IV | Kuh Sefid | 2k |
| IV | Bam | 99k |
| IV | Fasa | 98k |
Table of MMI estimates and populations for settlements falling within the map boundaries. The settlement name, location, and population are obtained from the freely-available GeoNames geographical database.