Georgia DroughtWatch
Current Drought Conditions in GeorgiaThis map below (from USGS's National Drought Watch Web site) shows the 7-day average streamflow conditions in major hydrologic units of Georgia. The colors represent 7-day average streamflow percentiles for the day of the year. Thus, the map shows conditions adjusted for this time of the year. About 60 USGS sites having at least 30 years of record are used. The data used to produce this map are provisional and have not been reviewed or edited. They may be subject to significant change.
More detailed information on drought in Georgia is available for:
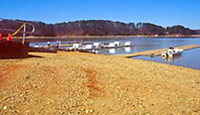
Georgia DroughtWatchThe severe drought in Georgia continues to make news, even though winter rainfalls have been close to normal. USGS continues to monitor streams and reservoirs. Drought Fact Sheets and Information
|

![]() U.S. Department of the Interior |
U.S. Geological Survey
U.S. Department of the Interior |
U.S. Geological Survey
URL: http://ga.water.usgs.gov/drought/drought.html
Page Contact Information: webmaster-ga@usgs.gov
Page Last Modified: Monday, 28-Jul-2008 09:45:40 EDT


