Participation Map & History
2018 Participation Map
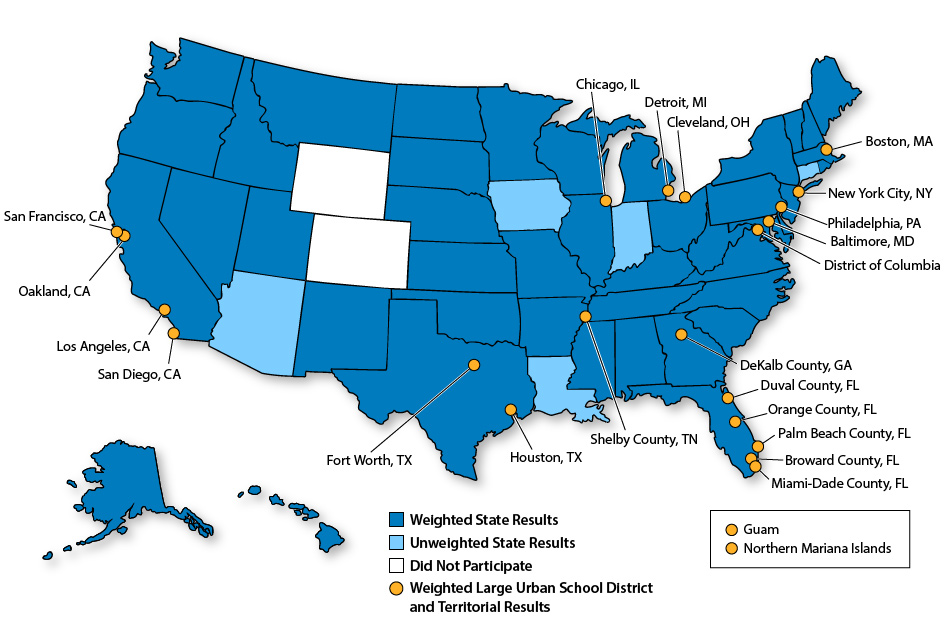
This map illustrates states, territories, and large urban school districts that participated in the School Health Profiles in 2018. Sites with weighted1 and unweighted2 results are shown.
Results
- If at least 70% of the principals or lead health education teachers in the sample completed the survey, the data are weighted to be representative of the state, large urban school district, or territory. With weighted data, it is possible to say, for example, “X% of schools in our state offer students intramural activities or physical activity clubs.”
- Unweighted data represent only the schools that completed the questionnaire.
Page last reviewed: November 15, 2019