
Unified Interior Regions
Region 1: North Atlantic-Appalachian
Our Science Centers

The NAA Region has 15 Science Centers spanning 14 NE States and Washington, DC. The Centers conduct interdisciplinary biologic, geologic, hydrologic, and energy monitoring and research addressing natural resource issues facing our nation.
Learn MoreFebruary Photo Contest
Check out the winning photographs in the February 2020 Photo Contest! Categories include People, USGS at Work, Where We Work, and Honorable Mention
See PhotosRegions L2 Landing Page Tabs
We conduct impartial, multi- and interdisciplinary research and monitoring on a large range of natural-resource issues that impact the quality of life of citizens and wildlife throughout the New England and Mid-Atlantic states of Connecticut, Delaware, Kentucky, Maine, Maryland, Massachusetts, New Hampshire, New Jersey, New York, Pennsylvania, Rhode Island, Vermont, Virginia, and West Virginia.
News

Field Photo Friday Winner for December 2020
A field crew collects sediment samples from Hoyt Lake in Buffalo, New York (Credit: Scott George, USGS NY WSC. Public domain.)

New England WSC Data Releases and Publications - 2020
List of publications and data releases from the New England WSC released in 2020.

The New England WSC Hydrologic Monitoring Program - December 2020
The Hydrologic Monitoring Programs (HMP) conducts hydrologic surveillance and investigation in all six New England States.
Publications

Photoperiodic regulation of pituitary thyroid-stimulating hormone and brain deiodinase in Atlantic salmon
Seasonal timing is important for many critical life history events of vertebrates, and photoperiod is often used as a reliable seasonal cue. In mammals and birds, it has been established that a photoperiod-driven seasonal clock resides in the brain and pituitary, and is driven by increased levels of pituitary thyroid stimulating hormone (TSH) and...
Irachi, Shotaro; Hall, Daniel J.; Fleming, Mitchell S; Maugers, Gersende; Bjornsson, Bjorn; Dufour, Sylvie; Uchida, Katsuhisa; McCormick, Stephen D. Seasonality of acarological risk of exposure to Borrelia miyamotoi from questing life stages of Ixodes scapularis collected from Wisconsin and Massachusetts, USA
Measures of acarological risk of exposure to Ixodes scapularis-borne disease agents typically focus on nymphs; however, the relapsing fever group spirochete, Borrelia miyamotoi can be transmitted transovarially, and I. scapularis larvae are capable of transmitting B. miyamotoi to their hosts. To quantify the...
Han, Seungeun; Hickling, Graham J.; Ogden, Nicholas H.; Ginsberg, Howard S.; Kobbekaduwa, Vishvapali; Rulison, Eric L.; Beati, Lorenza; Tsao, Jean I.
Research priorities for migratory birds under climate change—A qualitative value of information assessment
The mission of the U.S. Geological Survey National Climate Adaptation Science Center is to provide actionable, management-relevant research on climate change effects on ecosystems and wildlife to U.S. Department of the Interior bureaus. Providing this kind of useful scientific information requires understanding how natural-resource managers make...
Rubenstein, Madeleine A.; Rushing, Clark S.; Lyons, James E.; Runge, Michael C.
Region 1: North Atlantic-Appalachian PFAS Capability Team
Per- and polyfluoroalkyl substances (PFAS) are a group of anthropogenic emerging contaminants. Some PFAS have been voluntarily phased out, as exposure has been linked to adverse human health effects.

New England Drought, 2020
New England experienced a combination of above normal temperatures and below normal precipitation beginning in mid-May that led to a flash drought and rapid drying of soil. Near record warmth and below normal precipitation has persisted through October.

Functional and Molecular Bioassay Laboratory
The Functional and Molecular Bioassay Laboratory applies and modifies microbial and eukaryotic reporter bioassays to detect the presence of bioactive chemicals from environmental water samples. These analyses compliment analytical chemistry and biological datasets.

Monitoring Merrimack River Mainstem and Tidal Reaches in Massachusetts to Evaluate Water Quality Conditions, May to September 2020
The Merrimack River watershed, the 4th largest watershed in New England (Massachusetts Executive Office of Environmental Affairs, 2001), has seen substantial growth and development in recent years.

Groundwater Quality of Domestic Supply Wells in Pennsylvania
Most rural residents in Pennsylvania use groundwater from domestic supply wells for drinking, cleaning and other purposes. Some groundwater samples have been analyzed for private purposes, but those results generally are not readily available to the public. Many of the publicly available water-quality samples from rural areas were collected more than 30 years ago. Quality-assured groundwater...

Shale Gas and Water Resources in Pennsylvania
The Pennsylvania Water Science Center and other USGS scientists are studying water availability, use, quality, and ecology associated with development of shale-gas energy resources in Pennsylvania.
Latest Report: Potter County 'Baseline' Groundwater Quality (see Publications)

Samples Repository
Since 2002, the Woods Hole Coastal and Marine Science Center’s Samples Repository (WHCMSC) has been supporting research by providing secure storage for geological, biological, and geochemical samples; maintaining organization and an active inventory of these sample collections; as well as by providing access to these collections for study and reuse.

Streamflow Estimation from Advanced Imaging (LSPIV) in Pennsylvania
Pennsylvania Water Science Center and the Next Generation Water Observing Systems (NGWOS) Program are implementing new technologies for streamflow estimation at sites in Pennsylvania where conventional measurement techniques are inadequate.


Delaware River Basin
In Pennsylvania, the USGS's water-resources roots date back to the late 1800's, with the initiation of streamflow gaging on the Delaware and Susquehanna Rivers and assessments of groundwater resources near Philadelphia. The USGS Pennsylvania Water Science Center continues to provide scientific information about the water resources of the Delaware River Basin, in cooperation with regional and...

MD-DE-DC WSC Water Use & Water Supply Capabilities
In Maryland, public supply water is delivered to users for domestic, commercial, and industrial purposes. Most is used for public services, such as public pools, parks, firefighting, water and wastewater treatment, and municipal buildings, and some is unaccounted for because of leaks, flushing, tower maintenance, and other system losses. 5.7 million Marylanders get their water from the public...

MD-DE-DC WSC Modeling Capabilities
USGS models are widely used to predict responses of hydrologic systems to changing stresses, such as increases in precipitation or ground-water pumping rates, as well as to predict the fate and movement of solutes and contaminants in water.
The USGS is at the forefront of devising new techniques and computer software to solve practical problems in the study of water resources....

Sea-floor sediment samples, seabed imagery, and CTD instrument data collected on Stellwagen Bank in July and August, 2019, U.S. Geological Survey Field Activity 2019-008-FA
This cruise was conducted in collaboration with the Stellwagen Bank National Marine Sanctuary, and the data collected will aid research on the ecology of fish and invertebrate species that inhabit the region.

New England Below Normal 28-day average streamflow compared to historical streamflow for the day of year
Below Normal 28-day average streamflow compared to historical streamflow for the day of year
 - Black (TM)")
Continuous Seismic Profiling (CSP) at Callahan Mine Site: May 2017 to July 2018
In May 2017 and July 2018, continuous seismic profiling (CSP) surveys were collected in Goose Pond at the Callahan Mine site. The chirp frequency CSP tool was used in the deep water. A tuned transducer (dual-echo sounder) was used in the shallow water, and the data are served separately but within this data release (See CSP-DSO). CSP methods use an acoustic sound source that trave

Loads and trends in the Chesapeake Bay nontidal monitoring network: results through Water Year 2018
The U.S. Geological Survey (USGS) has developed the nontidal network mapper to share the short-term (2009-2018) water-year nutrient and suspended-sediment load and trend results for the Chesapeake Bay Program’s (CBP) non-tidal network (NTN). The mapper provides the primary findings for nitrogen, phosphorus and suspended-sediment trends, and gives the user tools to further examine the results...
Pesticide Toxicity Index (PTI) and maximum Toxic Unit (TUmax) scores and information for fish, cladocerans, and benthic invertebrates from water samples collected at National Water Quality Network sites during Water Years 2013-2017
During 2013-2017, the U.S. Geological Survey, National Water-Quality Assessment (NAWQA) Project, collected water samples year-round from the National Water Quality Network – Rivers and Streams (NWQN) and reported on 221 pesticides at 72 sites across the US in agricultural, developed, and mixed land use watersheds. Pesticide Toxicity Index (PTI) scores, a screening-
Chemical and physical data for sediment source fingerprinting of suspended and bottom sediment in Black Creek, Indiana, tributary to the Maumee River and western Lake Erie - Fluvial-target samples
This data release includes physical and chemical data for samples from fluvial targets (streambed and suspended sediment) from three sampling sites in the Black Creek basin, Indiana. Data include total nitrogen and carbon concentrations, carbon species, total concentrations for 42 metals, and particle-size analysis. Fluvial-target samples include both soft, streambed sediment and
Chemical and physical data for sediment source fingerprinting of suspended and bottom sediment in Black Creek, Indiana, tributary to the Maumee River and western Lake Erie - Source samples
This data release includes physical and chemical data for samples from upland-source and streambank sampling sites in the Black Creek basin, Indiana. Data include total nitrogen and carbon concentrations, carbon species, total concentrations for 42 metals, and particle-size analysis. Source samples were identified as one of five land-use types: active cropland (corn, soybean, h
Data for multiple linear regression models for predicting microcystin concentration action-level exceedances in selected lakes in Ohio
Site-specific multiple linear regression models were developed for eight sites in Ohio—six in the Western Lake Erie Basin and two in northeast Ohio on inland reservoirs--to quickly predict action-level exceedances for a cyanotoxin, microcystin, in recreational and drinking waters used by the public. Real-time models include easily- or continuously-measured factors that do not require
Precipitation and Precipitation Chemistry in Robinson Forest, Breathitt County, Kentucky (1971-2018)
Robinson Forest, in eastern Kentucky, is a research forest owned and operated by the University of Kentucky (UK) since the 1920s. The UK Department of Forestry and Natural Resources began collecting precipitation and precipitation chemistry data in the forest starting with one weather station at the Robinson Forest Camp in 1971, and followed by several additional stations in the mid-199
Air temperature in Robinson Forest, Breathitt County, Kentucky (1971-2018)
Robinson Forest, in eastern Kentucky, is a research forest owned and operated by the University of Kentucky (UK) since the 1920s. The UK Department of Forestry and Natural Resources began collecting air temperature data at the Robinson Forest Camp in 1971. This digital dataset includes information about the weather station where these data were collected, and how these data were process
Chesapeake Bay River Input Monitoring Network 1985-2019: Annual loads
Nitrogen, phosphorus, and suspended-sediment loads, and changes in loads, in major rivers across the Chesapeake Bay watershed have been calculated using monitoring data from the Chesapeake Bay River Input Monitoring Network (RIM) stations for the period 1985 through 2019. Nutrient and suspended-sediment loads and changes in loads were determined by applying a weighted regression appro
Chesapeake Bay River Input Monitoring Network 1985-2019: WRTDS input data
Nitrogen, phosphorus, and suspended-sediment loads, and changes in loads, in major rivers across the Chesapeake Bay watershed have been calculated using monitoring data from the Chesapeake Bay River Input Monitoring Network (RIM) stations for the period 1985 through 2019. Nutrient and suspended-sediment loads and changes in loads were determined by applying a weighted regression appro

The New England Water Science Center has collected, reviewed, and aggregated water-withdrawal data in each of the six States every 5 years since 1950. The most recent water-use compilation was completed in 2015, and its summary is presented in this geonarrative.

Exploring Shoreline Positions of the United States From the 1800s To The Present. Beach erosion is a chronic problem for many coastal areas of the United States. This geonarrative explains how the USGS derives shorelines from various data
sources, and how shoreline change rates are generated from these data.

U.S. Geological Survey researchers develop tools to forecast coastal change hazards. This geonarrative features research and tools developed to forecast real-time coastal change.

U.S. Geological Survey Researchers Monitor Barrier Islands. This geonarrative features research used to monitor Barrier islands which are narrow stretches of sand deposited parallel to the shoreline, are inherently valuable ecosystems. They protect estuaries and lagoons that help reduce coastal erosion, purify the water, and provide habitat for fish and birds.

USGS Coastal Change Hazards research provides scientific tools to protect lives, property, and the economic well being of the Nation. The mission of the USGS Coastal Change Hazards Program is to provide research and tools to protect lives, property, and the economic well-being of the Nation. This is a story map that introduces the value of our coasts and the threats they face with global change.

Coastal wetlands, and salt marshes specifically, are simultaneously geomorphic and biologic systems. They proliferate across a narrow range of elevation, water level, and salinity conditions. Salt marshes rely on their own growth and sediment input to maintain or increase their extent, whereas physical forces such as waves and sea-level rise tend to reduce it.

Third River - Lower Passaic River Basin 2020
Lower Passic River - Third River Basin 2020

Second and Third Rivers - Lower Passaic River Basin 2020
Lower Passaic River Basin 2020

Second River - Lower Passaic River Basin 2020
Lower Passaic River - Second River Basin 2020

Domestic wells provide drinking water supply for approximately 40 million people in the United States. Knowing the location of these wells, and the populations they serve, is important for identifying heavily used aquifers, locations susceptible to contamination, and populations potentially impacted by poor-quality groundwater.

The New England WSC geonarrative explores the availability of water-quality data collected by the Cape Cod National Seashore and U.S. Geological Survey in support of the Herring River restoration project. It highlights the development of the monitoring program since the 1980s and the recent publication of Cape Cod National Seashore data in a U.S. Geological Survey data release.

Simulated 25-year mean annual potential recharge to groundwater for Maine, 1991 to 2015.
Photoperiodic regulation of pituitary thyroid-stimulating hormone and brain deiodinase in Atlantic salmon
Seasonal timing is important for many critical life history events of vertebrates, and photoperiod is often used as a reliable seasonal cue. In mammals and birds, it has been established that a photoperiod-driven seasonal clock resides in the brain and pituitary, and is driven by increased levels of pituitary thyroid stimulating hormone (TSH) and...
Irachi, Shotaro; Hall, Daniel J.; Fleming, Mitchell S; Maugers, Gersende; Bjornsson, Bjorn; Dufour, Sylvie; Uchida, Katsuhisa; McCormick, Stephen D. Seasonality of acarological risk of exposure to Borrelia miyamotoi from questing life stages of Ixodes scapularis collected from Wisconsin and Massachusetts, USA
Measures of acarological risk of exposure to Ixodes scapularis-borne disease agents typically focus on nymphs; however, the relapsing fever group spirochete, Borrelia miyamotoi can be transmitted transovarially, and I. scapularis larvae are capable of transmitting B. miyamotoi to their hosts. To quantify the...
Han, Seungeun; Hickling, Graham J.; Ogden, Nicholas H.; Ginsberg, Howard S.; Kobbekaduwa, Vishvapali; Rulison, Eric L.; Beati, Lorenza; Tsao, Jean I. Research priorities for migratory birds under climate change—A qualitative value of information assessment
The mission of the U.S. Geological Survey National Climate Adaptation Science Center is to provide actionable, management-relevant research on climate change effects on ecosystems and wildlife to U.S. Department of the Interior bureaus. Providing this kind of useful scientific information requires understanding how natural-resource managers make...
Rubenstein, Madeleine A.; Rushing, Clark S.; Lyons, James E.; Runge, Michael C.
Investigation of U.S. Foreign Reliance on Critical Minerals—U.S. Geological Survey technical input document in response to Executive Order No. 13953 Signed September 30, 2020
Over the past few decades (1990–2019), the United States has become reliant on foreign sources to meet domestic demand for a large and growing number of mineral commodities. In combination with recent trends towards progressively concentrated supply of mineral commodities from a limited number of countries, this heightened import reliance may...
Nassar, Nedal T.; Alonso, Elisa; Brainard, Jaime L.
Considerations for incorporating quality control into water quality sampling strategies for the U.S. Geological Survey
This report describes considerations for incorporating routine quality-assessment and quality-control evaluations into U.S. Geological Survey discrete water-sampling programs and projects. U.S. Geological Survey water-data science in 2020 is characterized by robustness, external reproducibility, collaborative large-volume data analysis, and...
Medalie, Laura
Quality of data from the U.S. Geological Survey National Water Quality Network for water years 2013–17
Water samples from 122 sites in the U.S. Geological Survey National Water Quality Network were collected in 2013–17 to document ambient water-quality conditions in surface water of the United States and to determine status and trends of loads and concentrations for nutrients, contaminants, and sediment to estuaries and streams. Quality-control (QC...
Medalie, Laura; Bexfield, Laura M. Optimal sampling design for spatial capture‐recapture
Spatial capture‐recapture (SCR) has emerged as the industry standard for estimating population density by leveraging information from spatial locations of repeat encounters of individuals. The precision of density estimates depends fundamentally on the number and spatial configuration of traps. Despite this knowledge, existing sampling design...
Dupont, Gates; Royle, J. Andrew; Nawaz, Muhammad Ali; Sutherland, Chris
Assessment of Ambystomatid salamander populations and their breeding habitats in the Delaware Water Gap National Recreation Area
This report presents abundance and occurrence data for three species of ambystomad salamanders (Ambystoma maculatum, A. jeffersonianum, and A. opacum) collected over a 3-year period (2000, 2001, and 2002) at 200 potentional breeding sies within the Delaware Water Gap National Recreation Area (DEWA). In addition, numerous measures of inpond, near-...
Snyder, Craig D.; Young, John A.; Julian, James T.; King, Tim L.; Julian, Shanon E. U.S. mineral supply chain security in the age of pandemics and trade wars
Modern technology makes use of numerous mineral commodities whose production is concentrated in a few countries. New research identifies the commodities whose supply disruption poses the greatest risk to the manufacturing sector. While the analysis is applied to the U.S. manufacturing sector, the principles are equally applicable to other...
Nassar, Nedal; Fortier, Steven M. Ancient Egyptian mummified shrews (Mammalia: Eulipotyphla: Soricidae) and mice (Rodentia: Muridae) from the Spanish Mission to Dra Abu el-Naga, and their implications for environmental change in the Nile valley during the past two millennia
Excavation of Ptolemaic Period (ca. 309–30 BC) strata within Theban Tombs 11, 12, -399-, and UE194A by the Spanish Mission to Dra Abu el-Naga (also known as the Djehuty Project), on the west bank of the Nile River opposite Luxor, Egypt, yielded remains of at least 175 individual small mammals that include four species of shrews (Eulipotypha:...
Woodman, Neal; Ikram, Salima Along-margin variations in breakup volcanism at the Eastern North American Margin
We model the magnetic signature of rift-related volcanism to understand the distribution and volumeofmagmatic activity that occurred during the breakup of Pangaea and early Atlantic opening at the Eastern North American Margin (ENAM).Along-strike variations in the amplitude and character of the prominent East Coast Magnetic Anomaly (ECMA) suggest...
Greene, John A.; Tominaga, Masako; Miller, Nathaniel C. Cortisol is an osmoregulatory and glucose-regulating hormone in Atlantic sturgeon, a basal ray-finned fish
Our current understanding of the hormonal control of ion regulation in aquatic vertebrates comes primarily from studies on teleost fishes, with relatively little information on more basal fishes. We investigated the role of cortisol in regulating seawater tolerance and its underlying mechanisms in an anadromous chondrostean, the Atlantic sturgeon...
McCormick, Stephen D.; Taylor, Meghan L.; Regish, Amy M.")
Purge Analyzer Tool - For computation of in-well time of travel of groundwater under pumping conditions.
")
The Floodplain and Evaluation Tool (FACET) is an open-source python tool that maps the floodplain extent and derives reach-scale summaries of stream and floodplain geomorphic measurements from high-resolution digital elevation models (DEMs).
")
The Coupled-Ocean-Atmosphere-Wave-Sediment Transport (COAWST) Modeling System is an agglomeration of open-source modeling components that has been tailored to investigate coupled processes of the atmosphere, ocean, and waves in the coastal ocean.

Digital Shoreline Analysis System version 5.0

This software release provides the database application that runs the Massachusetts Sustainable-Yield Estimator (MA SYE) computer program (version 2.0).

This software release provides the database application that runs the Connecticut Streamflow and Sustainable Water Use Estimator (CT SSWUE) computer program (version 1.0).

A collaborative effort to organize and distribute Matlab tools for the Oceanographic Community

To assist decision makers in risk assessments, two sets of indices have been developed to rank terrestrial vertebrates for their utility in biomonitoring and susceptibility.

This package is used to calculate coastal geomorphology variables along shore-normal transects. The calculated variables are used as inputs for modeling geomorphology using a Bayesian Network (BN).

Bandit is the latest in a series of desktop applications aimed at helping bird banders manage and submit their data for banded birds. We have tried to make the process of maintaining banding records as simple as possible. Bandit was created by the Bird Banding Laboratory (BBL) at the USGS Patuxent Wildlife Research Center, Laurel, MD.

The Contaminant Exposure and Effects-Terrestrial Vertebrates database (CEE-TV) contains contaminant exposure and effects information for terrestrial vertebrates (birds, mammals, amphibians and reptiles) that reside in estuarine and coastal habitats along the Atlantic, Gulf and Pacific Coasts including Alaska and Hawaii and in the Great Lakes Region.

Frequently Asked Questions for the Contaminant Exposure and Effects-Terrestrial Vertebrates (CEE-TV) Database

Checking in on a benchmark and taking recovery photos
Surface Water Modeling for FEMA Flood Insurance Rate Maps.
USGS Hydrologic Technicians Terrence Talbot and Gunther Schletter take field notes and benchmark recovery photos after checking in at the benchmark.

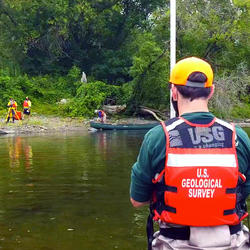
Taking channel measurements from a canoe
Surface Water Modeling for FEMA Flood Insurance Rate Maps.
USGS employee in a canoe hold a prism and survey rod level while the channel point is collected with a total station from shore.

Checking the channel measurement
Surface Water Modeling for FEMA Flood Insurance Rate Maps.
USGS employees check a channel measurement taken with a total station on a river near St. Johnsbury, VT.

Behind the Total Station
Surface Water Modeling for FEMA Flood Insurance Rate Maps.
Hydrologic Technician Gunther Schletter takes a channel measurement using a Total Station on a river near St. Johnsbury, VT.

Setting reference marks
Surface Water Modeling for FEMA Flood Insurance Rate Maps.
USGS employees use a GPS to set reference marks next to a damn near St. Johnsbury, VT.
Taking a channel measurement
Surface Water Modeling for FEMA Flood Insurance Rate Maps.
A USGS employees stands in the river channel keeping a prism on a survey rod level while a point measurement is taken with a total station located on the river bank.
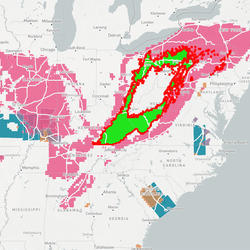
Earth MRI Funds Critical Minerals Projects in West Virginia
USGS map of Earth MRI projects in West Virginia announced in September 2020.

Stony Brook near West Suffield, CT during 2020 drought
Station 01184100 Stony Brook near West Suffield, Connecticut.
Photo shows a stretch of channel that is almost dry. There was such little flow that non-conventional means of discharge measurement was required, instead of wading with a velocity meter in a cross section
...
2020 drought impact on Stony Brook near West Suffield, CT
Station 01184100 Stony Brook near West Suffield, Connecticut.
Photo shows a stretch of channel that is almost dry. There was such little flow that non-conventional means of discharge measurement was required, instead of wading with a velocity meter in a cross section
...
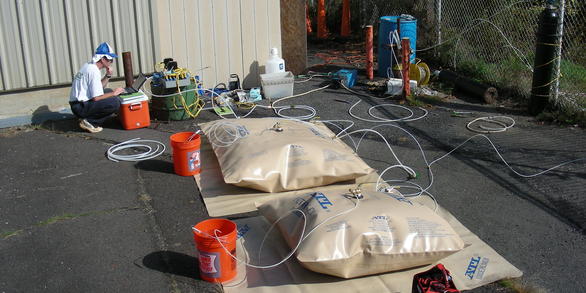
USGS Hydrologic Technician Collecting Water Samples
USGS Hydrologic Technician assisting with collection of downwelling porewater samples in a PFAS-impacted lake on Cape Cod.

SDC Seminar: Defining and Using Evidence in Conservation Practice
This is the Science and Decisions Center Seminar Series presentation of Defining and Using Evidence in Conservation Practice with Nick Salafsky, Director, Foundations of Success. Nick focuses on sharing new work on the development of shared evidence libraries based around theory-of-change pathways for key conservation actions. Nick draws on insights of evidence-based

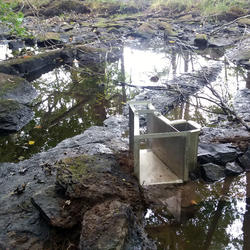
Dry river bed during 2020 drought - Mill River, Cheshire, CT
Station 01196588 Mill River at Cook Hill Rd. in Cheshire, Connecticut.
Photo shows a stretch of channel where our river stage gage is (outside staff gage). The river bed is dry, zero discharge.

A field crew collects sediment samples from Hoyt Lake in Buffalo, New York (Credit: Scott George, USGS NY WSC. Public domain.)
List of publications and data releases from the New England WSC released in 2020.
The Hydrologic Monitoring Programs (HMP) conducts hydrologic surveillance and investigation in all six New England States.

A total of $125,000 will fund new research and preserve important data across the Mountain State

A total of $118,479 will fund new research and preserve important data across the Pine Tree State

A total of $100,000 will fund new research and preserve important data across the Keystone State
The New England Water Science Center has collected, reviewed, and aggregated water-withdrawal data in each of the six States every 5 years since 1950. The most recent water-use compilation was completed in 2015, and its summary is presented in this geonarrative.

The scarcity or overabundance of water presents some of the most dangerous, damaging and costly threats to human life, ecosystems and property in the form of drought, floods and debris flows.
Current information to help with understanding the extent and severity of the recent drought in New England.

To learn more about USGS’s role in providing science to decision makers before, during, and after Hurricane Isaias, visit the USGS Hurricane Isaias page at https://www.usgs.gov/isaias.

To learn more about USGS’s role in providing science to decision makers before, during, and after Hurricane Isaias, visit the USGS Hurricane Isaias page at https://www.usgs.gov/isaias.

Over 80 points have been added since last week! Keep up the good work!
Contacts
Locations

Office of Communications and Publishing
Energy and Minerals Mission Area Headquarters

Environmental Health Mission Area Headquarters

Chesapeake Bay Program
Phone: (800) YOUR-BAY (968-7229)
Fax: (410) 267-5777

Region 1: North Atlantic-Appalachian

New York Water Science Center - Coram Program Office
saterrac@usgs.gov
Phone: (631) 736-0783
Fax: (631) 736-4283
Climate Research and Development Program Office
Mineral Resources Program Office
Phone: 703-648-6100
Fax: 703-648-6057
Land Change Science Program Office
Office of Budget, Planning, and Integration (BPI)
Phone: (703) 648-4431
Fax: (703) 648-4441

Science and Decisions Center

New York Water Science Center - Ithaca Program Office
gkbutch@usgs.gov
Phone: (607) 266-0217
Fax: (607) 266-0521

MD-DE-DC Water Science Center
information@usgs.gov
Phone: 443-498-5500
Fax: 442-498-5510
National Minerals Information Center
nmicrecordsmgt@usgs.gov
Fax: 703-648-4995

Leetown Science Center
Phone: 304 724-4400

New England Water Science Center - Connecticut Office
Phone: 860-291-6740
Fax: 860-291-6799

Patuxent Wildlife Research Center
webmaster@patuxent.usgs.gov
Phone: 301 497-5500

Pennsylvania Water Science Center
Phone: 717-730-6900
Fax: 717-730-6997

Florence Bascom Geoscience Center
Phone: 703-648-5953
New Jersey Water Science Center
Phone: (609) 771-3900
Fax: (609) 771-3915

Northeast Climate Adaptation Science Center

New England Water Science Center - New Hampshire/Vermont Office
Phone: (603) 226-7800
Fax: (603) 226-7894

Kentucky - Louisville Office
mgriffin@usgs.gov
Phone: (502) 493-1900
Fax: (502) 493-1909

Kentucky - Williamsburg Field Office
mgriffin@usgs.gov
Phone: (606) 549-2406
Fax: (606) 549-5400

Eastern Energy Resources Science Center

Kentucky - Murray Field Office
mgriffin@usgs.gov
Phone: (270) 759-2460
Fax: (270) 649-2461
Eastern Mineral & Environmental Resources Science Center

Chesapeake Bay Activities
Phone: 443-498-5552
Fax: 443-498-5510
Kentucky Water Science Center
Phone: (502) 493-1900
Fax: (502) 493-1909

Virginia and West Virginia Water Science Center
Phone: (804) 261-2600
Fax: (804) 261-2657

New England Water Science Center - Massachusetts/Rhode Island Office
Phone: (508) 490-5000
Fax: (508) 490-5068

New York Water Science Center - Troy Program Office
dc_ny@usgs.gov
Phone: (518) 285-5695
Fax: (518) 285-5601

Woods Hole Coastal and Marine Science Center
Phone: 508-548-8700
Fax: 508-457-2310

Reston Stable Isotope Laboratory (RSIL)
Phone: 703-648-5859

New York Water Science Center - Potsdam Field Office
gkbutch@usgs.gov
Phone: (315) 265-4410 / (518) 285-5602
Fax: (315) 265-2166


Pittsburgh
Phone: 412-569-1005
Williamsport
Phone: 570-323-7127
Fax: 570-323-2137


Lake Ontario Biological Station
blantry@usgs.gov
Phone: 315-343-3951
Fax: 315-342-8065

Tunison Laboratory of Aquatic Science
jemckenna@usgs.gov
Phone: 607-753-9391
Fax: 607-753-0259
Patuxent Wildlife Research Center - Beltsville Lab
Patuxent Wildlife Research Center - Virginia Polytechnic Institute
USGS S.O. Conte Anadromous Research Center

USGS Reston Library - Clarence King Memorial Library (Main Library)
library@usgs.gov
Phone: 703-648-4301
Fax: 703-648-6373
Office of External Research
Phone: (443) 498-5505
Fax: (703) 648-5002