Paul Coverdell Acute Stroke Program 2012–2015 Evaluation Summary
Overview
To reduce the burden of disease, disability, and death from stroke, the Centers for Disease Control and Prevention (CDC) funded the Paul Coverdell National Acute Stroke Program (Coverdell Program) to monitor, promote, and improve the quality of acute stroke care in the United States.
In 2012, CDC funded 11 state health departments through 3-year cooperative agreements to improve stroke care by developing systems for in-hospital settings (n = 11) and at least one other part of the system of care (i.e., pre-hospital [n = 8] or post-hospital [n = 3] care).
Coverdell-funded state health departments included Arkansas, California, Georgia, Iowa, Massachusetts, Michigan, Minnesota, New York, North Carolina, Ohio, and Wisconsin. Coverdell-funded programs are leading the development and implementation of system-change efforts to improve emergency response, enhance the quality of stroke care, and improve transitions—from emergency medical services (EMS) to acute care in hospitals, and from hospitals to home, rehabilitation, stroke specialist care, and primary care—across the continuum of care. CDC collaborated with RTI International to collect and analyze data for the evaluation of the 2012–2015 Coverdell state grantees.

The Burden of Stroke
- Stroke remains a leading cause of preventable long-term disability and is the fifth leading cause of death in the United States.1
- In the United States, stroke results in one death every 4 minutes.1
- Although significant advances have been made in preventing and treating stroke, the rising prevalence of heart disease, diabetes, and obesity has increased the relative risk for stroke, especially in the African-American population.2,3
- The lifetime direct costs of health care and indirect costs of lost productivity due to stroke are staggering and impose a substantial economic burden. According to the American Stroke Association, stroke-related health care services, medications, and lost productivity cost Americans about $34 billion in 2011.4
Evaluation Methods
A national evaluation of the 2012–2015 Coverdell Program consisted of a process and outcome case study evaluation for each grantee, a cross-site analysis, and a cost study. Individual case studies were aggregated to assess themes related to implementation of components of stroke systems of care within state contexts, including formation of partnerships, implementing quality improvement, expanding data linkages, and improving quality of stroke care. Grantees also provided data on the costs for implementing the Coverdell Program from 2012 to 2015. The outcome evaluation assessed overall improvements in delivery of stroke care, as well as state- and programmatic-level factors associated with improvements in delivery of stroke care. A particularly important indicator of quality of stroke care is the amount of time to treatment for acute stroke patients as measured by door-to-needle time (less than 60 minutes).
The comprehensive evaluation was guided by objectives and questions. Click each objective to see a list of sample questions.
- How have the quality improvement support and activities provided by the Coverdell Program contributed to improvements in the delivery and quality of stroke care?
- To what extent have stroke systems of care been implemented by Coverdell-funded grantees?
- What are the direct and indirect program costs related to (1) administration, (2) hospital recruitment and retention, (3) data collection and management, (4) clinical guidance and expertise, (5) quality improvement, and (6) program evaluation?
- What outcomes improved in the delivery of stroke care?
- What aspects of stroke systems of care—individually and in combination—contributed to improved quality of care?
The evaluation was based on the following data sources and analytic methods. Click each source to see a description of methods.
- Qualitative analysis to identify and compare patterns in interview responses within and across sites.
- Qualitative comparative analysis to examine program- and state-level factors that were sufficient or necessary to produce low door-to-needle time.
- Quantitative analysis using:
- Cochran-Armitage tests to analyze trends in registry measures.
- Bivariate analyses and multivariable, multilevel logistic regression models to examine state-level and hospital-level factors associated with registry measures at Coverdell-participating hospitals.
- Cost analysis to assess the average cost and in-kind contributions of implementing the Coverdell Program by resource category, program activity, and program setting.
Evaluation Findings
Progress Toward Implementation
Coverdell Grantees’ Efforts to Alleviate the Burden of Stroke
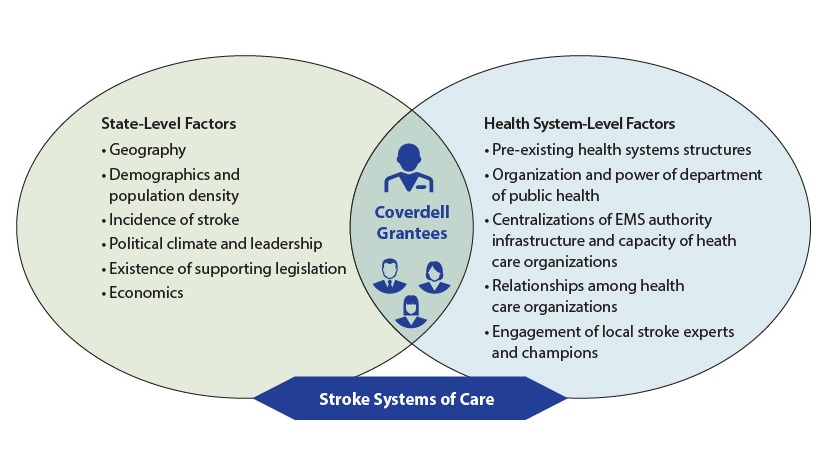
State-level and health system-level contextual factors can affect state health departments’ efforts to establish stroke systems of care and should be considered when designing these systems.
Coverdell grantees implemented a wide variety of quality improvement (QI) activities that accounted for their state’s unique context, such as the following:
- Disseminating information and resources, and providing training and technical assistance.
- Establishing programs to foster collaboration between EMS and hospitals.
- Developing stroke action teams.
- Rewarding hospitals that achieved excellence on performance measures.

Implementation Costs
This study was the first to comprehensively document actual costs of implementing QI from a state-level public health perspective for components of stroke systems of care across multiple programs.
This information can inform future budget and planning efforts, as well as potential scale and spread of similar programs across the country.
- Six grantees reported Coverdell-funded expenditures with a median value of $949,850 ($790,123 to $1,298,160) over the 3-year grant period.
- Health departments supported program efforts with five grantees reporting median in-kind contributions of $6,329 ($5,805 to $1,394,097) over the same period.
- Partners play an important role in implementing and financially supporting QI activities. Four grantees reported that a subset of partners5 (n=22) varied in their contributions, with a median cost incurred per partner of $29,049 ($3,912 to $362,868).

Progress Toward Outcomes
Through QI activities, Coverdell-participating hospitals significantly increased their adherence with all key performance measures—such as door-to-needle time, stroke education, dysphagia screening, recording of NIH Stroke Scale Score, and defect-free care—during the 2012–2015 funding cycle. Despite these improvements in the quality
of care, disparities in stroke care were observed by age, gender, race, and insurance status.
Overall, the percentage of patients with door-to-needle time of 60 minutes or less at Coverdell-participating hospitals significantly increased from 47% at the beginning of the 2012–2015 funding cycle to about 62% by the end of the funding cycle (p-value < 0.001).
Pathways to Improvement for Door-to-Needle Time
Using a qualitative comparative analysis (QCA), the evaluation paired qualitative themes with registry data to examine combinations of program- and state-level conditions that were sufficient or necessary to produce improvements in door-to-needle time over the 3-year cooperative agreement. The QCA analyzed themes that emerged from key informant interviews, identified state-level and program-level activities based on these themes, and categorized grantees as either engaging in the activity or not engaging in the activity.
The specific program- and state-level factors were selected because the scholarly literature and evaluation interview data suggested that they were critical to establishing stroke systems of care and reducing door-to-needle time. Grantee contextual factors were modeled in combination with grantee-level improvements in their door-to-needle time measurements during the program. Nine of the 11 grantees focused their efforts on improving transitions of care between EMS and hospitals, meaning that nine grantees engaged in programmatic activities that could contribute to improvements in door-to-needle time and were included in this analysis.
Findings demonstrate that grantees achieved improvements in door-to-needle time through three programmatic pathways defined by specific combinations of program-level and state-level factors. When paired with policies or protocols that support collaboration, Coverdell-sponsored opportunities for collaboration and problem-solving among Coverdell hospitals and their partners were associated with improvements in door-to-needle time.
Conclusions
Coverdell grantees implemented program components within their state-based and health-systems contexts. Program-level and state-level factors contributed to quality of stroke care. Evaluation findings demonstrate improvements in pre-hospital transitions of care and in-hospital care, represented by increased timeliness of stroke care and improvements in door-to-needle time. Potential future focus areas include expanding upon quality improvement work that has begun in the post-acute care setting, establishing data linkages across the continuum of care, and addressing disparities in stroke care.
For questions about the evaluation of the Paul Coverdell National Acute Stroke Program, e-mail arebheartinfo@cdc.gov.
- American Heart Association. Heart Disease, Stroke and Research Statistics At-a-GlanceCdc-pdfExternal. Dallas, Texas: American Heart Association; 2016.
- Gillum RF. Stroke mortality in blacks: Disturbing trends. Stroke. 1999;30: 1711–1715.
- American Stroke Association. Impact of stroke websiteExternal. Accessed September 2017.
- Mozaffarian D, Benjamin EJ, Go AS, et al. Heart disease and stroke statistics—2015 update: A report from the American Heart Association. Circulation. 2015; 131:434-441.
- Subset of partners represent <5% of the total partners listed by the grantee. While limited data demonstrate high variability, additional evaluation efforts are needed to collect a more representative sample of grantee partner costs.