California Water Science Center
Maps
Maps help us make sense of complex data and information. Many California Water Science Center Projects are built on a foundation of spatial data. Maps are and used to help analyze and understand information including water quality trends, optimal groundwater recharge locations, estuary flow patterns, areas of land subsidence and more. Maps of our maps provdide access to data directly.
Assessing Phytoplankton and Nutrient Abundance in the San Francisco Estuary and Delta
A data visualization exploring the relationship between nutrient distribution and phytoplankton under different conditions across the San Francisco Delta and Estuary. Assessing distribution and abundance aids understanding of how managing nutrient supplies affects aquatic food webs, helping managers evaluate the potential environmental benefits of future nutrient reduction efforts against costs.
Nutrient, Phytoplankton and Water Quality Maps (2018) | Bay-Delta Regional Monitoring Program
Data visualization tool created for California's Bay-Delta Regional Monitoring Program. This web application visualizes nutrients and phytoplankton spatially and temporally for data collected in 2018.
Domestic Wells in the United States
Domestic wells provide drinking water supply for approximately 40 million people in the United States. Knowing the location of these wells, and the populations they serve, is important for identifying heavily used aquifers, locations susceptible to contamination, and populations potentially impacted by poor-quality groundwater.
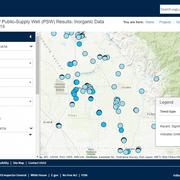
Public-Supply Well Water Quality Results: Inorganic Data and Trends, 1974 - 2014 (California GAMA-PBP)
The GAMA-PBP Public-Supply Well Results data viewer allows the user to visualize and download California water-quality data and trends for1974 - 2014. Groundwater-quality data for 38 inorganic constituents are captured and can be downloaded for individual sites or by grid cell.
Anza Hydrologic Data
A portal for easy access to USGS data collected during hydrogeologic research projects in Anza Valley, CA
Anza Valley Land Use (1934 - 2005)
Compares Anza Valley, CA land use data within the USGS study boundaries for 5 time periods between 1934 and 2005.
GAMA Public-supply Well (Deep Aquifer) Assessment Study Units
The GAMA program is a comprehensive statewide assessment designed to help better understand and identify risks to groundwater resources. Groundwater is sampled at many locations across California in order to characterize its constituents and identify trends in groundwater quality. The results of these tests provide information for water agencies to address a variety of water resource issues.
GAMA Domestic Well (Shallow Aquifer) Assessment Study Units
n 2012, the Groundwater Ambient Monitoring & Assessment Priority Basin Project (GAMA-PBP) began water-quality assessments of shallow aquifers, which are typically used for private domestic and small system drinking-water supplies. GAMA-PBP is designed to identify where and to what extent water quality of groundwater aquifers meets benchmarks that have been established for drinking water.
Coastal Drainage Basins in San Diego County, California
Coastal Basins of San Diego County, California, and Northern Baja California, Mexico. Local features include the San Dieguito River Basin, San Diego River Basin, Sweetwater River Basin, and Otay River Basin. Maps also display locations of groundwater-monitoring sites.
Assessment of Groundwater Quality in the Borrego Valley
The quality of groundwater in the Borrego Valley is a concern because it is the sole source of water for agricultural, recreational, and public supply. Explore this interactive water-quality data map for detailed information and to download data.
San Antonio Creek Valley Hydrologic Monitoring
In order to understand the integrated hydrologic systems in the San Antonio Creek Valley, many different types of data are being gathered from both the surface water and groundwater system. Learn about these data types and explore them with the interactive map.
Lower Colorado River Hydrologic Monitoring
The Lower Colorado Monitoring Network is a series of groundwater-level and water-quality wells, as well as streamgages and micro-gravity sites. This interactive map displays the sites and provides links to the most current data.


